"Essentially, all models are wrong, but some are useful."
Box, George E. P.; Norman R. Draper (1987). Empirical Model-Building and Response Surfaces, p. 424, Wiley. ISBN 0471810339.
Box, George E. P.; Norman R. Draper (1987). Empirical Model-Building and Response Surfaces, p. 424, Wiley. ISBN 0471810339.
Some Basics Before We Get Started. |
Krugman (K) Mod. 1
Mankiw (M) Ch. 1 |
The following are links to videos that will set the table of terms and concepts for broader discussions about economics.
Context for our study of Economics: The Big Picture
TERMS TO KNOW: scarcity, trade-off, efficiency or allocative efficiency, opportunity cost, marginal change, incentive, market failure, externality, productivity, inflation, positive versus normative economic perspectives.
AP 2.1
Circular Flow of Income |
Mankiw (M) Ch. 2
|
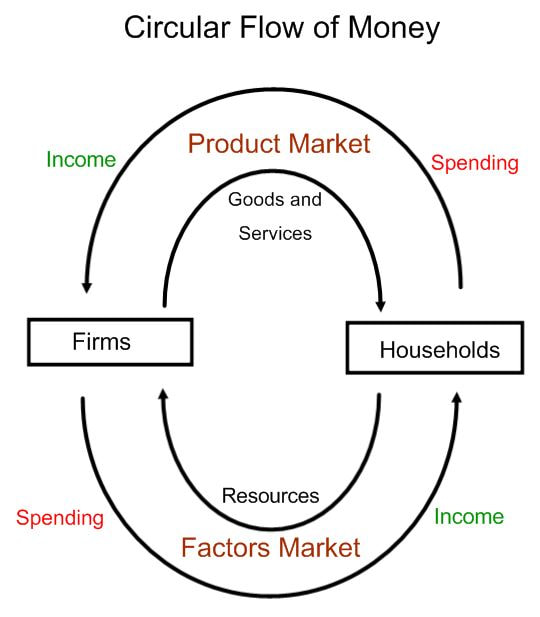
The 4 factors of production are land, labor, capital and entrepreneurship. From these factors of production all goods and services are produced. Land refers to natural resources. Labor refers to human resources. Capital refers to tools, machinery, or buildings. Entreprenuers are persons who see a new way to produce a product, or a new product that can be produced.
This model was developed by Frank Knight at the beginning of the 20th century. He was educated at Milligan University, at University of Tennessee, Knoxville, and earned his Ph. D at Cornell University. He became a notable professor at the University of Chicago, School of Economics.
|
Consider the Circular Flow of Money model.
What does the Circular Flow Chart demonstrate about the transfer and transformation of resources?
Terms to know: want, need, service, consumer good, capital good, public good, land, labor, capital, input, output. We will add the government's participation in the relationship between households and firms later in Unit 2. |
Throughout my website I will place links to videos that are helpful explanations of economic concepts and principles. Mr. Clifford is a former high school AP Economics teacher in San Diego County, California. Dr. Reff is a former Economics Professor at the University of Arizona. I also include a few videos from "Economics Mafia". The presenter is a mystery. Many students appreciate her slow and concise explanations. Use these videos to enhance what you learn in class and from your reading.
AP 2.7
For context: The Business Cycle
|
M Ch. 1
|
|
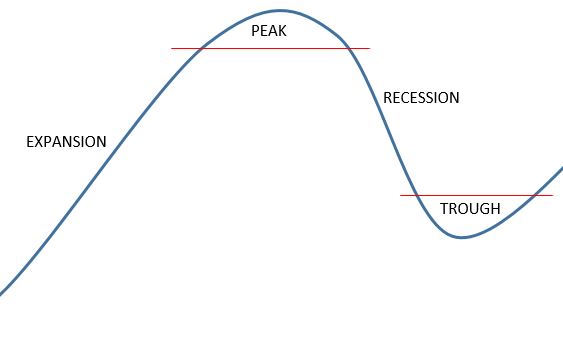
For context, Macroeconomics will discuss what occurs in the market at different points in the business cycle. The business cycle is the longer view of the circular flow model.
The four phases of the business cycle are Expansion, Peak, Recession, and Trough. Referring back to the Circular Flow Model, the Expansion gets its label from the expanding business activity or supply of money in the Circular Flow. During the Recession, business activity and the supply of money is contracting or receding. The Expansion and the Recession will be in our focus most of the course. For reference, pay attention to unemployment, consumer income, consumer spending, and business productivity. (We will add to these economic indicators later.) Note that the rate of unemployment affects consumer income, which affects consumer spending, which affects business productivity, which affects the unemployment rate. During an Expansion, unemployment decreases, consumer income increases, consumer spending increases, and business productivity increases. This trend recycles through these indicators throughout the expansion. During a Recession, consumer spending decreases, business productivity decreases, unemployment increases, and consumer income decreases. This trend recycles through these indicators throughout the recession. We will constantly be referring back to the business cycle to understand what trends occur in the market, what legislative and monetary actions may occur to manage the economy. For the longer view, take a look at "Growth In GDP per capita 1871-2009" link at the right. |
|
AP 1.1 and 1.2
The Production Possibilities Frontier (PPF) |
M Ch. 2
|
All economic systems deal with the problem of scarcity, which is the situation where there are limited resources to satisfy unlimited needs and wants. We have near 8 billion people on the planet, and limited resources on the planet to satisfy all needs and wants of our near 8 billion people. Scarcity forces people, firms and countries to make choices between what products to produce from available and limited resources.
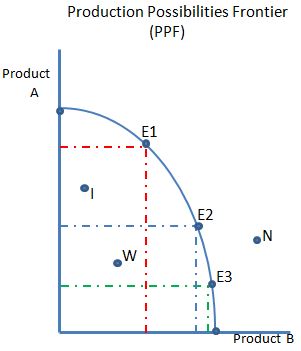
The alternative choices that are being confronted are called trade-offs. When a choice is made, it costs the decision-maker the opportunity to have their second choice. This is called an opportunity cost. The Production Possibilities Frontier and Curve represent these terms. The Production Possibilities Curve (PPC) represents the maximum that can be efficiently produced with the given scarce resources. The products on the axes represent the trade-off between producing product A or B. Points along the curve are choices that could be made. Moving along the descending curve product B is gained, but there is an opportunity cost represented by the number of product A given up. In the reverse on the PPC, product A would be gained and a quantity given up of product B would be the opportunity cost.
The alternative choices that are being confronted are called trade-offs. When a choice is made, it costs the decision-maker the opportunity to have their second choice. This is called an opportunity cost. The Production Possibilities Frontier and Curve represent these terms. The Production Possibilities Curve (PPC) represents the maximum that can be efficiently produced with the given scarce resources. The products on the axes represent the trade-off between producing product A or B. Points along the curve are choices that could be made. Moving along the descending curve product B is gained, but there is an opportunity cost represented by the number of product A given up. In the reverse on the PPC, product A would be gained and a quantity given up of product B would be the opportunity cost.
|
Note in our imaginary country, it produces 2 products. If it efficiently commits all of it's resources (land, labor and capital) to the production of these 2 products, it can produce any combination of products A and B along the Production Possibilities Curve (PPC), E1, E2 and E3. Achieving the maximum output from available resources of any combination of the two products is called allocative efficiency. If the country inefficiently uses its resources or is wasteful, it will produce some combination of products A and B that is below its potential output on the PPC. Consequently, they may produce inside the PPC at points I and W. If the country attempts to produce beyond its PPC at point N, it is simply not sustainable or possible because they do not have the resources to produce at that level.
|
PPCs that demonstrate Increasing Opportunity Costs versus Constant Curves.
The production possibilities curves (PPCs) that are represented above demonstrate "increasing opportunity costs". You'll notice in the first example of the PPF and PPC, the PPC is bowed out. The manufacture of products A and B from available resources are not equal. When giving up the manufacture of A to produce more of B, more of A was given up to produce a little more of B. Because there is not a 1 to 1 ratio, it is said that the curve demonstrates increasing opportunity costs. It doesn't matter whether you go down or up the curve, the ratio of change between products is not equal and opportunity costs are increasing. The bowed out curve is regarded as more accurate to reality.
|
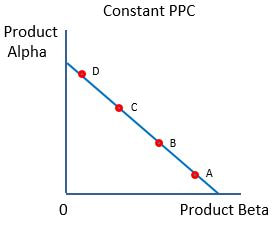
On a PPC that is straight, the ratio of giving up the manufacture of one product to the gain of the alternative product is the same any where along the curve. It is said that opportunity costs are constant along the PPC.
In the example to the right, moving from point A to B, or B to C, or even A to D, The ratio of giving up product Beta to gain more of product Alpha is the same. If we gave up Alpha to gain Beta, the ratio would be the same between points along the PPC. Anytime you are given a scenario that refers to constant opportunity costs, you need to draw a straight line for the PPC. |
|
ALERT! Here is what is confusing, sometimes economics textbooks will provide a graph of a straight PPC, but they are not suggesting that opportunity costs are constant. It's just easier to draw a straight line. For instance, the Geeklandia and Gearhead PPCs below, the PPCs could have been drawn straight because the important numbers were the maximum amounts of product each country could produce if they concentrated their resources on producing one or the other product. The focus was on comparative advantage, not increasing opportunity costs.
So, when asked on an AP Exam to draw a PPC showing constant opportunity costs, you must draw a straight line. When asked to draw a PPC showing increasing opportunity costs, you must draw a bowed out PPC. When asked to draw a graph demonstrating comparative advantage. draw 2 PPCs of the two countries, but you may draw either a constant curve or a bowed curve. What matters is the quantities of product on each axis at the ends of each PPC.
So, when asked on an AP Exam to draw a PPC showing constant opportunity costs, you must draw a straight line. When asked to draw a PPC showing increasing opportunity costs, you must draw a bowed out PPC. When asked to draw a graph demonstrating comparative advantage. draw 2 PPCs of the two countries, but you may draw either a constant curve or a bowed curve. What matters is the quantities of product on each axis at the ends of each PPC.
AP 1.3
Interdependence and the Gains from Trade
|
M Ch. 3
|
TERMS TO KNOW: absolute advantage, comparative advantage, terms of trade, imports, exports.
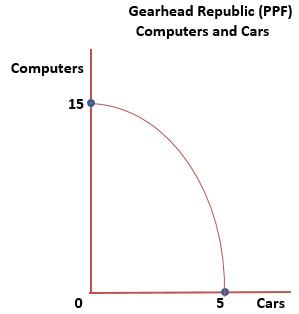
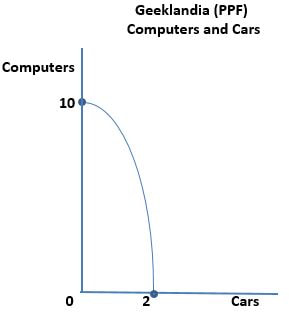
PPF: Absolute and Comparative Advantage between nations.
|
|
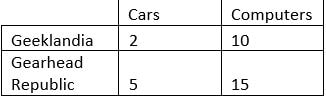
Note the production possibilities frontiers of the two countries to the right and left. Each country happen to make the same two products with their scarce resources. Gearhead Republic produces more cars and computers than Geeklandia. Gearhead Republic has absolute advantage over Geeklandia in producing both products.
|
|
|
Now, which country has comparative advantage in producing cars and computers. Stated another way, which country experiences the least opportunity cost producing a car or a computer.
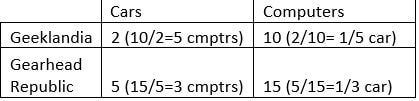
When you calculate comparative advantage for production output, set it up like the example, and place the "other over" to calculate the opportunity costs. "Other over" refers to the other product that could be produced if you hadn't put all your resources into producing the the product you are making. For instance, here we have placed the number of computers over the number of cars to determine how many computers are given up to make one car. Or, we have placed the number of cars over the number of computers to determine how many cars are given up to make one computer. "Other over". Notice that Gearhead Republic only gives up 3 computers to produce a car compared to Geeklandia who gives up producing 5 computers to produce a car. Gearhead Republic has comparative advantage over Geeklandia in producing cars. Notice that Geeklandia only gives up producing a 1/5th of a car to produce a computer, where Gearhead Republic gives up 1/3rd of a car to produce a computer. Geeklandia has comparative advantage over Gearhead Republic in producing computers. |
|
Terms of Trade
For both parties to gain from trade, the price must lie between their two opportunity costs. Return to our illustration of Geeklandia and the Gearhead Republic.
Geeklandia will trade computers for cars as long as the price is 1/5 of a car or greater for each computer. They would gladly accept more than 1/5 of a car for a computer. At minimum, they’ll accept 1/5 of a car. If less than 1/5 of a car is offered for a computer, they’ll produce the cars themselves.
Gearhead Republic will trade cars for computers as long as the price is 3 computers or greater for each car. They would gladly accept more than 3 computers for a car. At minimum, they’ll accept 3 computers. If less than 3 computers is offered for a car, they’ll produce computers for themselves.
Justifiction for trade: Comparative advantage is the basis of trade between countries. If each country concentrates on producing products in which they have comparative advantage, they will produce more than they need. Yet, when they trade their surplus product, they will acquire more of the product they don't produce than they could have produced for themselves.
There is a conservation component to this, as well. If countries concentrate on producing products in which they have comparative advantage, resources are being used by the most productive and efficient countries. By definition, less resources are used to produce more product by the efficient countries.
There is a conservation component to this, as well. If countries concentrate on producing products in which they have comparative advantage, resources are being used by the most productive and efficient countries. By definition, less resources are used to produce more product by the efficient countries.
AP 1.4
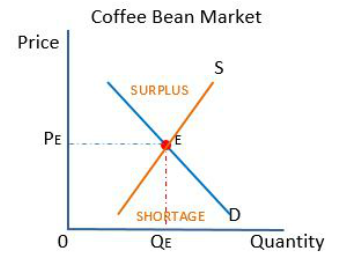
Impact of Supply and Demand on the Market
TERMS TO KNOW: market, demand, law of demand, quantity demanded, normal good, inferior good, substitutes, complements, supply, law of supply, quantity supplied, equilibrium, equilibrium price, equilibrium quantity, surplus, shortage.
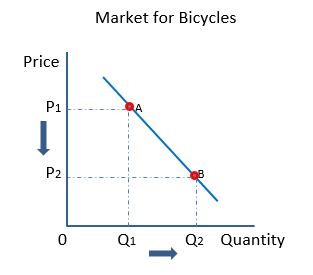
Demand
|
M Ch. 4
|
|
|
AP 1.5
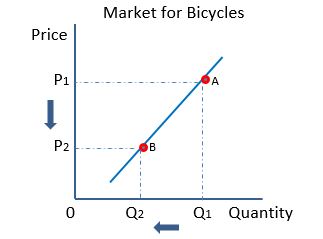
Supply
|
M Ch. 4
|
|
|
AP 1.6
Market Equilibrium |
M Ch. 4
|
|
|
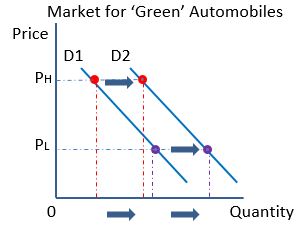
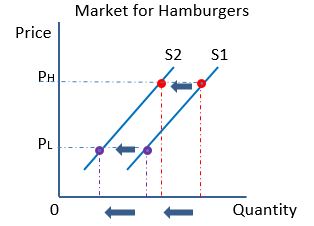
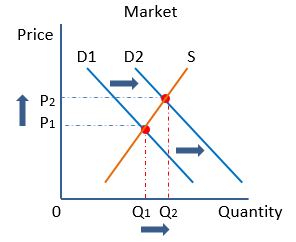
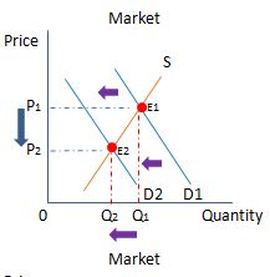
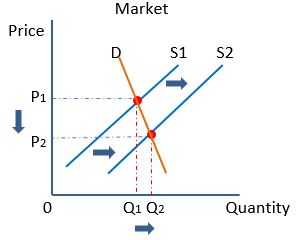
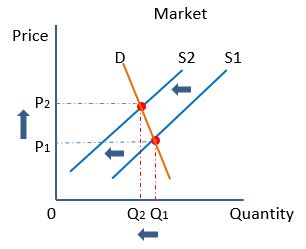
Changes in Market Equilibrium
|
|
|
|
Supply, Demand, and Government Policies
TERMS TO KNOW: disequilibrium, price ceiling, price floor, binding and non-binding price controls, tax incidence.
Disequilibrium is a term that is not used much in economics textbooks. However, it is used in the AP curriculum guide for Microeconomics and Macroeconomics. A definition can be secured in economics or finance dictionaries. Disequilibrium refers to when something has occured that forces the equilibrium out of what is set by the normal operation of supply and demand. Government policies, labor inefficiencies, drastic interruptions in supply of resources can all disturb the price and quantity buyers and sellers have agreed upon. However, the market adjusts to the new equilibrium that has been caused by government policies that often become permanent fixtures. So, the new equilibrium becomes the new normal equilibrium as buyers and sellers adjust to the government policies. The following government policies are examples of disequilibrium.
Price Controls in the Market |
M Ch. 6
|
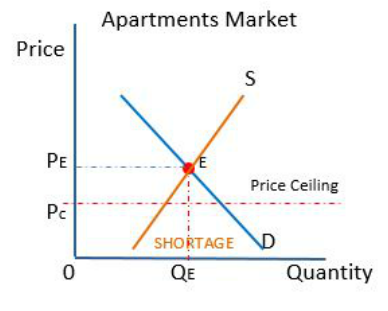
Price Ceilings
|
What are the effects of a price ceiling? Negative externalities.
|
Price Floors
There are 2 kinds of price floors to attend to: a non-binding Target Price and the binding Minimum Wage.
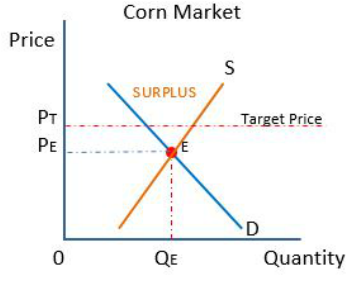
Target Price
|
|
Minimum Wage
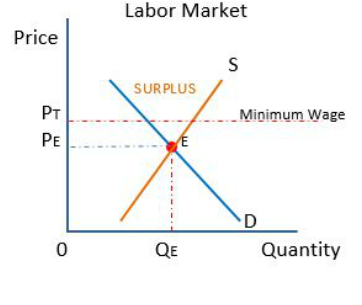
What are the effects of a price floor? Negative externalities.
|
|
Other Changes in Market Equilibrium |
M Ch. 6
|
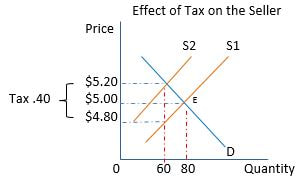
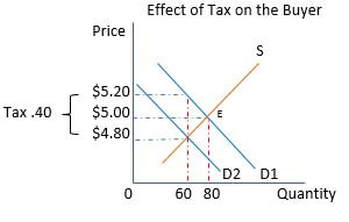
Taxes on sellers and on buyers
|
|
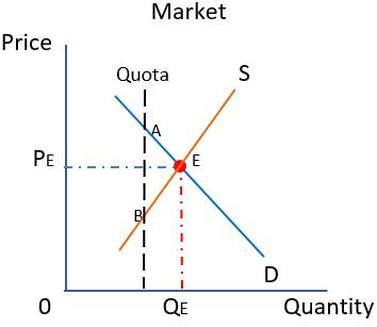
Quantity Controls
|
|
Payroll Taxes and the Tax wedge between firms and workers.

|
|
