|
Cort's Social Studies
|
Survey Economics
|
Unit 3: Macroeconomics
Beijing West Station: Subway, Train, Bus and Taxi
|
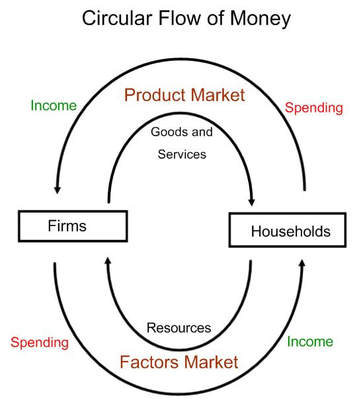
What are the 4 factors of production? (Land, Labor, Capital and Entrepreneurship)
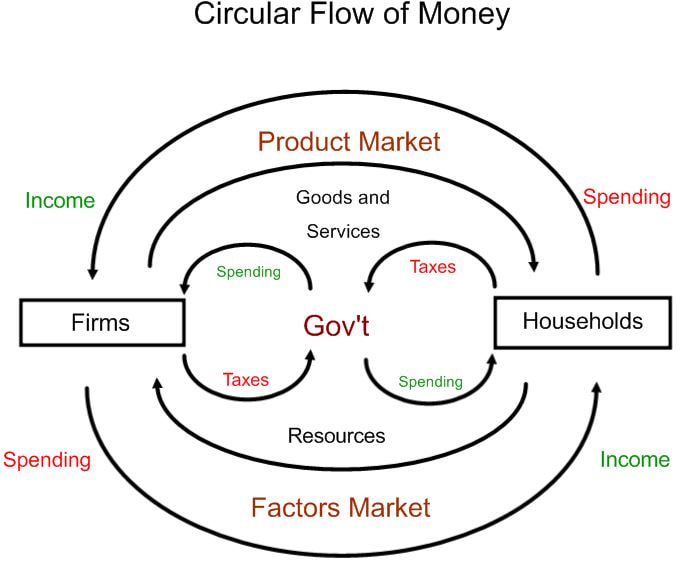
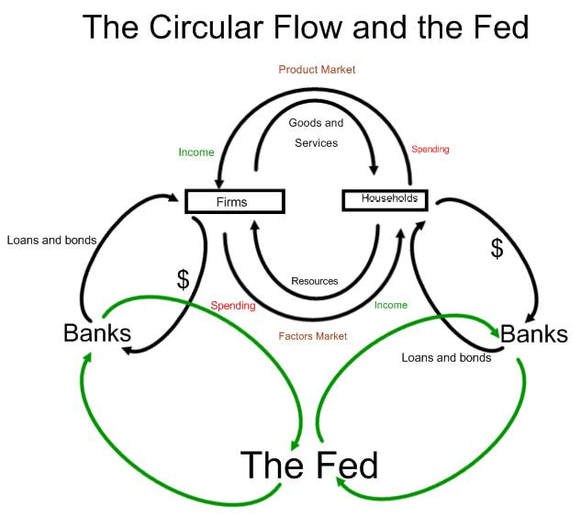
Remember the Circular Flow of Income model. What does the Circular Flow Chart demonstrate about the transfer and transformation of resources?
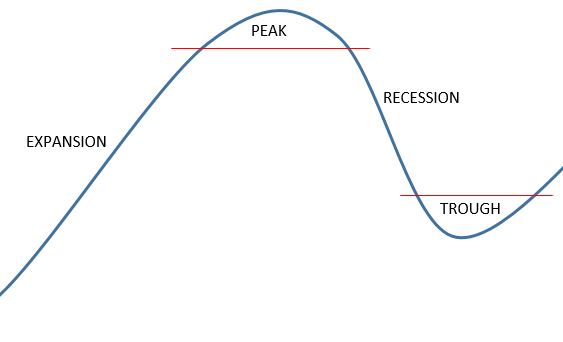
When activity between households/consumers and firms increases, the circular flow expands. When activity decreases, the circular flow is said to contract. These same terms, expand and contract, are used when describing the same activity with regard to the business cycle. The business cycle is a series of expansions and contractions of activity between households/ consumers and firms. |
|
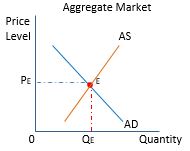
Just a note, we are not discussing any longer a particular product market. We are referring to the overall or aggregate consumer demand, the total or aggregate supply by all firms and the price level of all products. The graph that we refer to looks just like the supply and demand graphs we have been using, but we are applying them to a broader context. Quantity on the graph refers to the Real GDP. In some texts they will label the horizontal axis as Real GDP rather than Quantity.
|
|
|
|
Note:
|
|
|
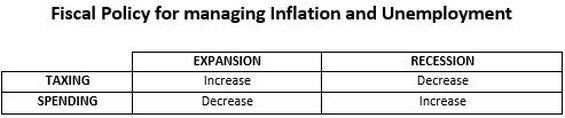
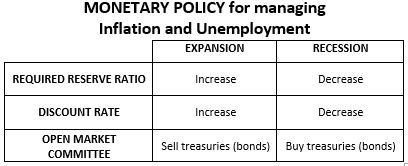
On the chart, horizontally, the appropriate government actions are listed for periods of economic expansion and periods of recession.
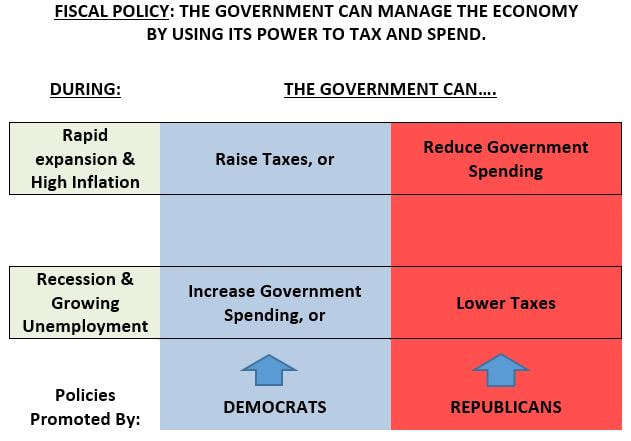
However, in the U.S., it appears that the Democratic Party advocates for two fiscal policy actions by the government (shaded blue) with always one that is inappropriate for either expansion or recession. The Republican Party is no better. They also advocate two fiscal policy actions by the government (shaded red), different from the Democrats. However, one is always inappropriate for either expansion or recession. Wherever you are, make sure lawmakers and those running for election make good economic sense. |
|
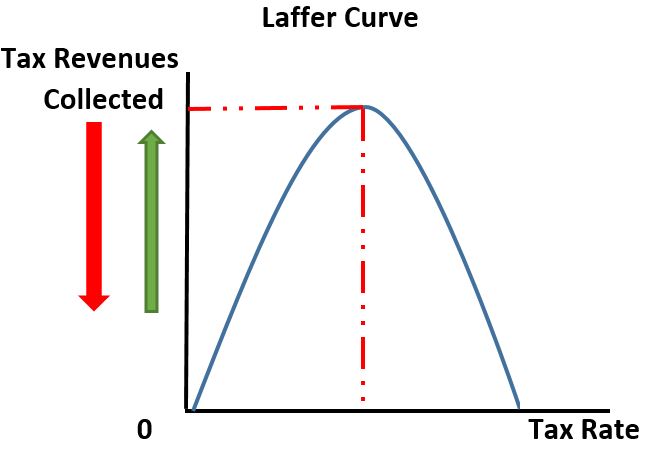
Arthur Laffer developed this model to demonstrate how tax cuts affect tax revenues and economic growth. At the top of the curve the tax collections are at their highest. However, as the tax rate continues to rise, tax collections start to decrease. Why?
People who have to pay those taxes find ways to avoid taxes. They turn down opportunities to earn greater income because the increase in income would place them in higher tax brackets. They find tax deferred or tax sheltered investments. Both legal and illegal means to avoid taxes are are used, like service providers taking cash payments instead of checks or credit cards to avoid a record of income upon which taxes must be paid. There is a point at which taxpayers believe they've paid enough. Mr. Laffer offered his model at a time when it was argued that lowering the taxes would actually increase tax revenues because the current tax rate was past the optimum level. It was offered as an argument for supply-side economics. |
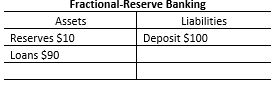
3. Required Reserve Ratio (RRR)
|
|
|
The problem to be addressed during economic Expansion is inflation. To reduce inflation, the Fed wants to reduce the supply of money by increasing the RRR and Discount Rate on banks, and the OMC authorizes the the sale of bonds.
The problem to be addressed during economic Recession is unemployment. To reduce unemployment, the Fed wants to increase the supply of money by decreasing the RRR and Discount Rate on banks, and the OMC authorizes the purchase of bonds. |
|
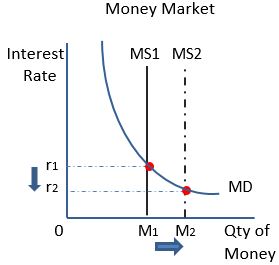
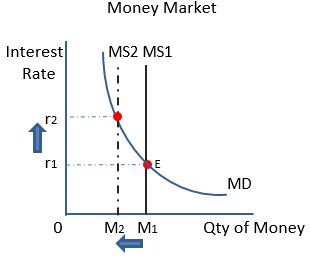
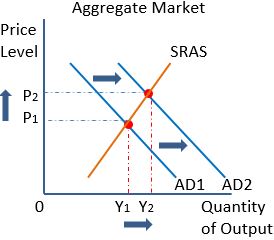
Expansionary Policy: During a recession, the Fed will increase the supply of money available at the banks (MS1 to MS2). Notice that the interest rate decreases as the equilibrium slides down the demand curve for money (MD). As borrowing money becomes more affordable. firms and households borrow money for spending. The economy is stimulated and the hope is that increased spending will decrease unemployment.
|
|
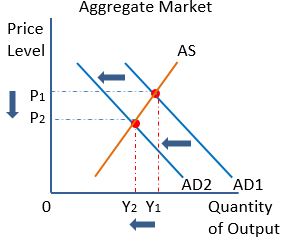
Contractionary Policy: During an expansion, the Fed will decrease the supply of money available at the banks (MS1 to MS2). Notice that the interest rate increases as the equilibrium slides up the demand curve for money (MD). As borrowing money becomes more expensive. firms and households borrow less money for spending. The economic expansion is slowed and the hope is that decreased spending will slow the rate of inflation.
|
|
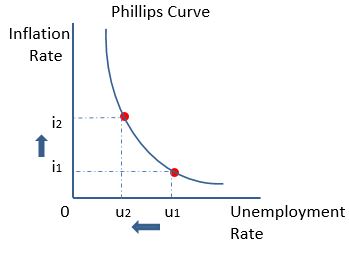
Phillips Curve: notice in the graph to the right, as the government works to reduce unemployment, people have more money to spend, and the inflation rate begins to increase.
Logically, if the government works on reducing the inflation rate, they must reduce the supply of money available to spend. Reduced spending leads to increased unemployment. This graph would show a reverse in inflation rate and unemployment rate. |
|
|
|
|
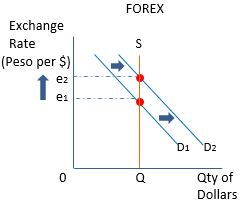
Consider the foreign exchange market (FOREX) that is to the right. The supply curve (S) is the supply of dollars to the market of Mexican Pesos to the US Dollar. The demand curve (D1) represent the Pesos being brought to the market to be exchanged for US Dollars. When consumers of Mexico want to buy US products, there is an increase in Pesos demanding to be exchanged into Dollars. The increased demand (D2) leads to a higher exchange rate, more Pesos to the Dollar. This means the Peso has depreciated and the Dollar has appreciated in value.
|
|
|
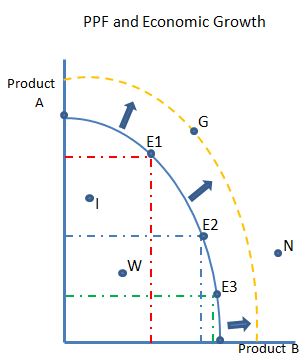
Remember the economy is about organizing and using factors of production: land, labor, capital and entrepreneurship. For economic growth to occur, there must be an increase of available natural resources, laborers, human capital and capital. Many of these resources can be increased through trade between nations based upon comparative advantage. Still, for developing nations, there are social and political issues that have to be overcome or managed in order to achieve a developed economy. The following presentation provides us a simple outline to discuss the needs of developing nations and what developed nations can do to help.
|
|
