Saving, Investing and Financial Institutions
Mankiw (M) Ch. 26
The Purpose of the Financial System
Before we look at the financial markets and financial intermediaries where people place their money for saving, or from whom they secure money for capital investment. In economics, our concern is capital investment, spending money on capital stock like equipment, buildings tools, or infrastructure to grow productive capacity. We are not concerned about financial investment, which is placing your money in an account, real estate or company stock because you anticipate earning a return or interest. While we will discuss stocks, bonds, and interest rates, our focus is on the economy and economic growth.
In a finance course, capital may be taken to reference cash, credit capacity, equity, or other funds that are available for financing the business. We will not address these issues, even though these are interesting topics to explore.
In a finance course, capital may be taken to reference cash, credit capacity, equity, or other funds that are available for financing the business. We will not address these issues, even though these are interesting topics to explore.
Financial Markets:
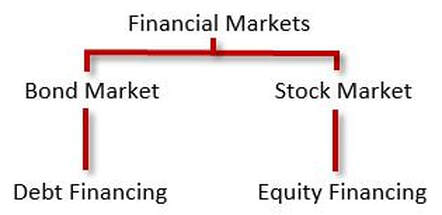
Bonds
Rather than borrowing money from a bank, sometimes businesses and institutions sell bonds to raise money for their organization. They are financing operations or projects with debt (debt financing). A bond is a written promise (bond certificate) to pay back money with interest after a specified time period. So,
- a bond is an I.O.U.
- a bond has a face value stating what will paid when it matures, or reaches the stated length of time
- a bond is purchased at a discounted price, below face value, and interest is included in the face value
Stocks
Rather than borrowing money from a bank, sometimes a business sells a portion of ownership to other businesses or individuals. They are financing operations or projects by selling equity or ownership in their company (equity financing). So,
- a stock is a portion or share of ownership in a corporation
- businesses only get money from the initial public offering (IPO) of stock
- thereafter, money is only exchanged between people buying and selling stocks in the stock market
- money is made from purchasing stocks of companies that are expected to grow more profitable and consequently the stock value will increase, buy low and sell high (honestly, it's legal gambling)
Stock Indexes
A stock index is computed as an average of a group of stock prices. Stock indexes are used to monitor the profitability and health of the stock markets. There are 2 major indexes,
- Dow Jones Industrial Average, which is based upon the stock prices of 30 major U.S. companies
- Standard & Poor's 500 Index, which is based upon the stock prices of 500 major companies
Financial Intermediaries
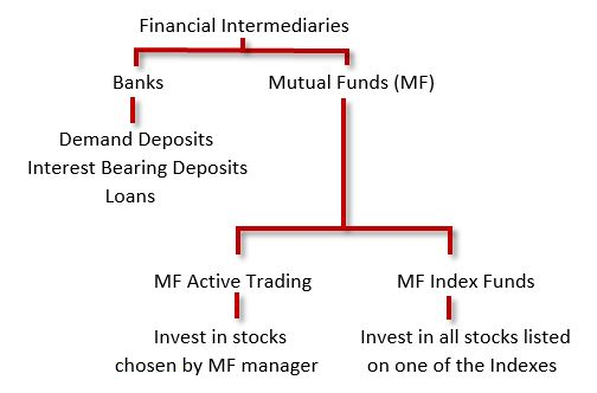
Banks
Banks manage the relationship between savers and borrowers.
- Savers place their money in accounts at the bank.
- The bank uses the savers' money to loan to borrowers.
- The cost of using the savers money is the interest paid to the savers.
- The income of the bank is the interest borrowers pay as the cost of using the bank's money.
- The interest on the loan is typically higher than the interest paid on the savers' accounts. The difference between the interest rates cover the bank's expenses and profit.
Mutual Funds
Mutual funds are companies that invest stocks, bonds, real estate, or some combination of investment opportunities. The above graphic shows stock mutual funds that only purchases stocks.
Some mutual funds are indexed, which means that they only buy stocks that are listed on one of the stock indexes. On average, indexed mutual funds earn approximately 2% more than actively traded mutual funds.
- The mutual fund sells shares in the mutual fund company.
- The mutual fund company uses the proceeds to invest in stocks, bonds, real estate or some combination of investment opportunities.
- The shareholders accept the risks and returns associated with the investment portfolio held by the mutual fund.
- The mutual funds get paid in an approximate range of .5% to 2% of asset value per year.
- The value of the shareholders' stake in the mutual fund increases by the rate of return minus what the mutual fund company gets paid.
Some mutual funds are indexed, which means that they only buy stocks that are listed on one of the stock indexes. On average, indexed mutual funds earn approximately 2% more than actively traded mutual funds.
National Income Accounting: Saving and Investing
The following are 2 different methods for explaining National Income Accounting. Both are provided because students may grasp one explanation better than the other. The goal is to understand National Income so that analysis and solutions to different economic scenarios may be developed by students.
Method 1: (from N. Gregory Mankiw text) |
M Ch. 26
|
Using the GDP Equation Y = C + I + G for a closed economic system
So, for national income accounting we start with our GDP equation, which is an accounting identity for us.
Y=C+G+I+NX
This equation represents an open economy because the NX indicates a nation freely trading with other nations. If we want to isolate the national savings, the NX is dropped from the equation, which represents a closed economy.
Y=C+G+I
National savings is the total income of the economy that remains after paying for consumption and government purchases. So, national savings (S) is S = Y-C-G. Notice how this is represented as an equation. Subtracting C and G from both sides of the equation, we end up with national saving equaling national capital investment.
Y = C+G+I
Y-C-G = (C+G+I)-C-G
Or, S = I
We can further isolate private and public savings. If national savings is S = Y-C-G, and we consider taxes (T), then
Private Savings is Y-T-C and Public Savings is T-G
So, National Savings considering taxes is S = (Y-T-C) + (T-G)
Note that if T>G, then there is a public budget surplus. Tax collections are greater than government spending.
Note that if T<G, then there is a public budget deficit. Tax collections are less than government spending.
Method 2: (from Paul Krugman text) |
K Mod. 22
|
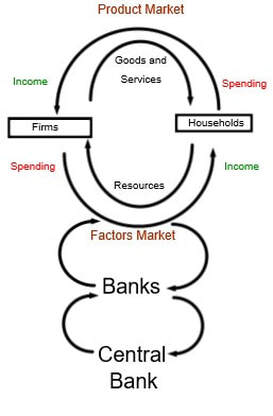
Recalling the Circular Flow Model when discussing National Income Accounting
Recall in the Circular Flow of Money Model that total spending by households and firms equals total income by households and firms.
Total Income = Total Spending
Regarding Total Income, households will save a percentage and spend a percentage of their income. So,
Total Income = Savings + Consumer Spending
Regarding Total Spending, it is the sum of consumer spending by households plus investment spending by firms.
Total spending = Consumer Spending + Investment Spending
Referring back to
Total Income = Total Spending
We can now say
Savings + Consumer Spending = Consumer Spending + Investment Spending
Subtracting Consumer Spending from both sides of the equation we have
Savings = Investment Spending
Because firms borrow from savings at financial institutions to invest in the purchase of physical capital. The state of our national savings is key to our economic growth.
National Savings = Public Savings + Private Savings
Public Savings is government savings
Public Savings = Tax Collections – Gov’t Spending
When the government runs a budget surplus, public savings and national savings increase.
When the government run a budget deficit, public savings and national savings decrease.
When National Savings decrease due to national budget deficits, or reduced households savings rate, firms will borrow money from savings in other countries. The inflow of foreign savings (foreign investment in our country) comes with the cost of interest.
If our firms borrow from foreign savings, the inflow is negative because we have accepted the liability to repay the loan plus interest.
If we lend to foreign firms from our savings, the outflow is positive because their liability to us is an asset. They will repay plus interest.
M Ch. 26
Market for Loanable Funds and Fiscal Policy
Financial Intermediaries stand between national savings and capital investment. Or, banks and mutual funds are financial bridges between savers and capital investors. A familiar looking supply and demand graph can illustrate the market for loanable funds.
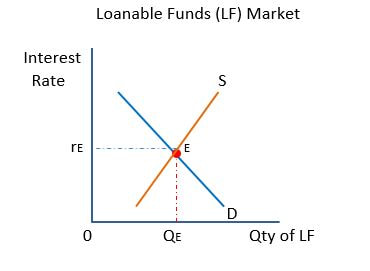
The supply of loanable funds comes from people and businesses, domestic and foreign, who have income left after paying expenses, surplus income. The government contributes to loanable funds when it spends less than it collected in taxes and has a budget surplus. They want to save their money in a bank. Households and firms, domestic and foreign, demand loanable funds from the market, when they want to make purchases on credit or to invest in capital stock. The real interest rate and the quantity of loanable funds to be supplied and demanded is indicated where the supply and demand curves are in equilibrium. Government fiscal policies affect the supply and demand for loanable funds and the interest rate.
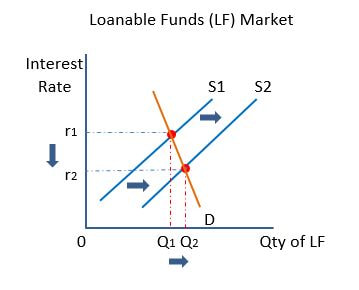
Government Policies that Increase Supply of Loanable Funds
|
a) Saving Incentives: The government may want to influence people to save more money.
|
4. In response to the lower interest rate, new borrowers will
enter the aggregate market because they can afford the cost of borrowing, the interest rate, and the monthly payments. Current borrowers may decide they can afford to borrow more. So, the aggregate demand will increase, shifting right from AD 1 to AD2. 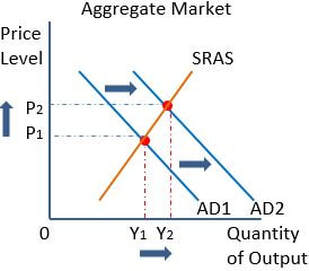
|
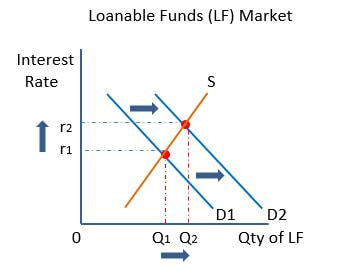
b) Retiring Government Debt: If the government spends less than it collects in taxes (T>G), the government will have a budget surplus.
c) Changes in Capital Inflows:
- It may choose to use the surplus to retire or pay-off debt.
- The net effect will be an increase in loanable funds.
- Consequently, the graphic representation for the government policy of using the budget surplus to retire debt would look like the above graph.
- The supply would shift right with no change in demand. Real interest rates would decrease.
- The aggregate demand would shift in the aggregate market just like the above graph.
c) Changes in Capital Inflows:
- If foreign investors perceive that a country is a safe place to invest and save money, the supply of savings will increase, shifting right, in the loanable funds market. The graphs above would, again, shift as they are represented.
- If foreign investors perceive that a country is an unsafe, or risky place to invest and save money, the supply of savings will decrease, shifting left, in the loanable funds market, and be placed in the loanable funds market of a safe country. In the unsafe country, the supply of loanable funds would shift left, creating a new equilibrium interest rate that is higher. The higher interest rate would to less borrowing, and less aggregate demand in the aggregate market. The aggregate demand curve would shift left. In this case, both graphs would be in reverse of what is shown in the above graphs.
A Government Policy that Increases the Demand for Loanable Funds
|
Investment Incentives: The government may want to encourage industries to invest in capital stock, thereby increasing the capacity for economic growth.
|
4. The higher interest rate in normal circumstances would
discourage demand (borrowing). However, the tax credits offset the effect of the interest rates, and industries borrow while the net cost of borrowing remains below the new equilibrium interest rate. Of course, for all other borrowers who don't qualify for the tax credit, the interest rate will be higher. 5. Tax credits could be given to other segments of the population. For instance, tax credits for buying a home. 6. In response to investment tax credits, borrowers will enter the aggregate market because they can afford the cost of borrowing, the interest rate, and the monthly payments. So, the aggregate demand will increase, shifting right from AD 1 to AD2. 
|
Two Alternative Graphs to show the affect of One Government Policy
in the Loanable Funds Market - Budget Deficit and Higher Interest Rates
|
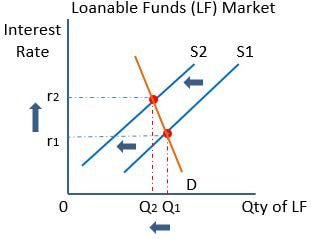
If the government spends more than it collects in taxes (T<G), the government will need to borrow money to pay for the services it provides the people. Depending upon the economics textbook or the AP preparation book you are using, two graphs are used to demonstrate the same effect in the loanable funds market. The graph at the right is the same as as the graph immediately above. The circumstances have changed. In this case,
|
|
|
The graph to the left is an alternative representation of budget deficit spending by the government. The supply curve represents national savings.
National Savings = Private Savings + Public Savings S = (Y-T-C) + (T-G)
Note: This same graph can be used to show the effect of raising taxes to cover increased government spending. The net effect is to reduce private savings and reduce national savings, which leads to higher interest rates. |
Deficit spending by the government slows or reduces private investment in capital stock. Multiple years of deficit spending continually shrinks the national economic capacity to grow and respond to economic challenges from other countries. The country becomes less competitive.
Basic Tools of Finance
Before we can consider how the Federal Reserve System (the Fed) can use monetary policy to affect the Loanable Funds Market, interest rates, inflation and unemployment, we need to know in greater detail tools and perspectives people have about money. What are people considering when they make decisions about saving, spending or investing their money?
Time Value of Money |
M Ch. 27
|
There are two equations that can be used to consider the time value of money.
Where, r = interest rate PV = Present Value
n = number of years FV = Future Value
Where, r = interest rate PV = Present Value
n = number of years FV = Future Value
- The Future Value of Present Money can be determined by using the following equation: FV = PV ∙ (1+r)ⁿ This equation assists in determining what will be the future value of present money saved or invested in a real estate investment assuming the interest rate is constant. If the money is in the bank, and the interest stays in the bank, interest paid on previously earned interest is called compounding.
- The Present Value of Future Money can be determined by using the following equation: PV = FV/(1+r)ⁿ , or PV = FV ∙ (1+r)⁻ⁿ . This equation assists in determining how much money must presently be invested to achieve a future value that has been set as a goal. The process of walking back from the future value to the present value is called discounting.
Other Tools and Considerations
The Rule of 70
One additional tool that is used in people's investment decisions is the rule of 70: People may wonder how many years it will take to double the value of their investment, or even to double real GDP.
Where r = interest rate, Then 70/r = the number of years to double value.
So, if the interest rate is 7%, the value of money invested will be 70/7 = 10 years. Of course this assumes a constant interest rate.
Where r = interest rate, Then 70/r = the number of years to double value.
So, if the interest rate is 7%, the value of money invested will be 70/7 = 10 years. Of course this assumes a constant interest rate.
(Students, some economics textbooks will introduce the rule of 70, some the rule of 72. These rules of 70 and 72 are derived from the Natural Logarithm of 2, which is 0.693147. The Rule of 70 is often used to determine the doubling of a variable like population growth. How long will it take to double the population at the current population growth rate? The rule of 72 is preferred in finance to explain how long it will take to double money invested using the current interest rate. Learn the rule that's in your text. If what you learned is different from what's on the AP test, don't worry. Use the number AP gives and perform the calculation that you learned. If you go into finance later and take a finance class in college, it will be the rule of 72.)
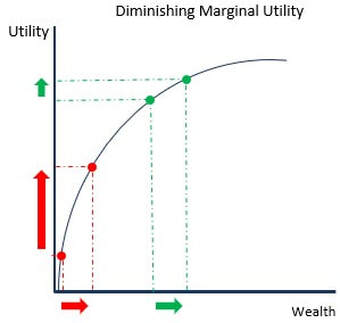
Risk Aversion - People like to avoid risks
|
|
- Diversification of one's investments is an attempt to avert losses. Diversification is the investing one's money in many different investment opportunities of differing levels of risk and return. The goal is to minimize risks while maximizing gains. Some stocks will grow, some will not. By diversifying, it is hoped that on average a gain will always be achieved. Diversification can eliminate risks associated with specific industries or firms, But, diversification cannot avoid market risks. There is always going to be risks to the entire market and economy that affect all industries and firms.
- There are trade-offs between risk and return. The higher the risk, generally the return will be high. A safe, low risk investment generally provides small returns. Diversification of a portfolio allows investors to choose trade-offs between risky and safe investments.
Asset Valuation
Fundamental Analysis: an effort to determine the value of a company in relation to its stock price.
Undervalued: Value > Price
Overvalued: Value < Price
Fairly Valued: Value = Price
The profitability of a stock depends upon a number of factors:
Undervalued: Value > Price
Overvalued: Value < Price
Fairly Valued: Value = Price
The profitability of a stock depends upon a number of factors:
- demand for the product of the company
- quality of the competition in the market
- how much capital the company has in place
- whether workers are unionized or not
- customer loyalty
- government regulations and taxes real and anticipated.
- Do the fundamental analysis on your own.
- Rely on Wall Street Analysts.
- Or, buy into a mutual fund whose analysts are focused on diversification. Remember that indexed funds earn on average 2% more than actively traded funds.
Efficient Markets Hypothesis
The hypothesis suggests the prices stated for assets (stocks) are fairly accurate to the value of the company. This is based upon 3 assumptions:
- The stock market reflects information efficiency, all available information about a stock is available.
- Rational decisions are made by buyers, sellers and analysts.
- Supply and Demand for a stock sets the price.
- The stock will be undervalued if the public overreacts to bad news, or under reacts to good news.
- The stock will be overvalued if the public does not react to bad news or overreacts to good news.
The Monetary System
Money and the Measurement of Money |
M Ch. 29
|
Function of Money:
|
|
|
Store of Value: The value of goods and services converted into money until a purchase may be made in the future. (i.e. An employee sells their services to an employer in exchange for money. The employee, as a consumer, will later spend the value of their services converted into money for goods and services they desire.
Medium of exchange: The seller will accept the money in exchange for goods and services if the money represents an equivalent value. Unit of Account (or Standard of Value): Money allows people to compare values (prices) of goods and services in relation to one another. |
Commodity Money: objects or products are used as money because they have intrinsic value (i.e. gold; salt; oil; cigarettes or condoms in prisons)
Fiat Money: Currency that has no inherent value, but is exchanged for value established by fiat or decree by the government. The money is worth what the government says it's worth. Currency: the paper bills and coins that represent fiat money |
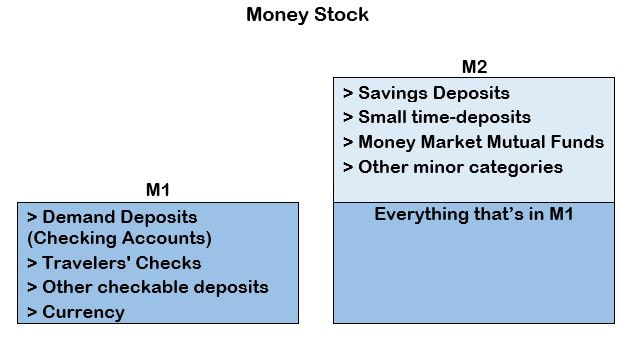
Money Stock in the EconomyMoney Stock is the total supply of money to the economy. The Federal Reserve System breaks the supply into categories. The two broadest categories are M1 and M2 as shown in the graphic. There are other categories (i.e. M3, M4) which looks at less liquid money-like assets. For our purposes, understanding M1 and M2 will help us understand people's use of banks and the Fed's policies to manage the supply of money available for use in the economy.
The M1 money supply includes all physical currency, traveler's checks, demand deposits, and other checkable deposits. M1 is a measure of all the most liquid forms of money in an economy. The M2 money supply includes everything in M1. Also, M2 includes savings deposits, money market securities, and other time deposits which are less liquid and not as suitable as exchange mediums. However, the M2 money supply can be quickly converted into cash or checking deposits. |
|
Recent Changes to the U.S. Monetary System
Every country has a central banking system for supervising their banking system, and to manage the supply of money. The name of the central banking system of the U.S. is referred to as the Federal Reserve System, or often referred to as the Federal Reserve Bank, or most commonly as the Fed.
NOTE: The U.S. Federal Reserve System formally adopted the “ample reserves regime” in 2019, with some modifications implemented in 2021. The earliest explanation of the ample reserves regime to appear in textbooks is this fall of 2023. Information you will receive from me will come from the St. Louis Federal Reserve Bank – FRED.
Other nations' central banks continue to use the "limited reserves regime", which the U.S. Federal Reserve System had used until recently.
AP requires that you learn both systems of managing the banking system by national central banks. You will be asked questions on the AP Exam about both systems and their respective operations. So, you must pay attention to the terms “with ample reserves” and “with limited reserves.” Also, if a question refers directly to the Fed, you are to answer with the "ample reserves" system in mind. If a question refers to a "central bank", look for clues directing your attention to either the "limited reserves" regime, or the "ample reserves" regime. Each regime has different tools and procedures for supervising banks and managing the supply of money to the economy. As an aside, central banks of Europe, the European Union, and the United Kingdom are skeptical of the "ample reserves" regime.
We will start with the current system used by the U.S. Federal Reserve System, then the limited reserves system used by all other central banks in the world.
In general, Central Banks Serve Their Banks and Their Governments
Central banks of nations provide services to the banking system and to their governments. Overlaying the services and actions of central banks are 2 mandates that they seek to achieve.
Mandates of central banks, and U.S. Federal Reserve System (the Fed):
1) Price stability (low inflation),
2) a stable economy (low unemployment).
3 ways the Central Banks and the Fed serve their banking systems:
3 ways the Federal Reserve System serves the Federal Government. (Central banks serve their governments in similar ways.)
Mandates of central banks, and U.S. Federal Reserve System (the Fed):
1) Price stability (low inflation),
2) a stable economy (low unemployment).
3 ways the Central Banks and the Fed serve their banking systems:
- It clears checks of banks and their customers.
- It lends money to banks that have short-term cash flow issues.
- It regulates and supervises the financial practices of banks.
3 ways the Federal Reserve System serves the Federal Government. (Central banks serve their governments in similar ways.)
- It issues checks for Social Security, Medicare, IRS tax refunds, federal employee paychecks.
- The Fed sells and processes US savings bonds and other securities.
- It distributes US currency through the banks.
The Federal Reserve System
We have seen the institutions through which people supply and demand money. We have also addressed people's perspectives about the risks and rewards of investing. The quantity of money available to the economy can be adjusted to influence the rate of inflation. The Federal Reserve System (the Fed), in the United States, adjusts the supply of money in the economy (monetary policy) to minimize risks of participating in the economy. Before we can address the Fed and monetary policy, we must first understand how the banks and the banking system operate.
M Ch. 29
Organization
- As the central bank of the US, the Federal Reserve (the Fed) has two primary responsibilities: 1) supervise the banking system, and 2) regulate the quantity of money in the economy.
- The Board of Governors has 7 members who supervise the operations of the Fed and set policy. The President appoints and the Senate approves each member to 14-year terms.
- The President chooses the Chairperson from the members of the Board of Governors to a 4-year term.
- The current Chairperson of the Fed is Jerome Powell.
- The country is organized into 12 district banks, each with a president charged to carry out the national monetary policy set by the Board of Governors.
- The Federal Open Market Committee (FOMC) includes the 7 governors and 5 of the 12 Fed bank presidents. The New York Fed President is always on the FOMC, the other 4 seats for presidents is rotated among the remaining 11. The FOMC sets the Interest on Reserves (IOR) to influence the Federal Funds Rate between banks and the nominal interest rate in the economy. The FOMC also supervises the sale and purchase of government securities (bonds).
- All nationally chartered banks are automatically members of the Federal Reserve System.
U.S. Federal Reserves System with AMPLE RESERVES
The following information comes directly from the St. Louis Federal Reserve Bank – FRED.
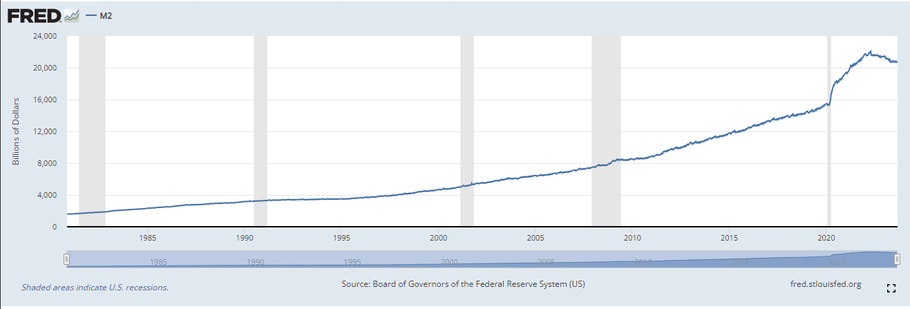
As you can see, the supply of money in M2 has grown significantly since the Fed made the commitment to an Ample Reserves regime for managing the economy. Note the Y-axis is thousands of billions of dollars. So, we're talking about trillions of dollars in circulation. The Fed reports that in response to the Financial Crisis of 2007- 2009, the level of reserves was raised from $15 billion in 2007 to over $2.7 trillion by 2014. With so much money in circulation, the open market operations (OMO) of the Fed became less effective at managing the money supply for the purposes of achieving low inflation and low unemployment.
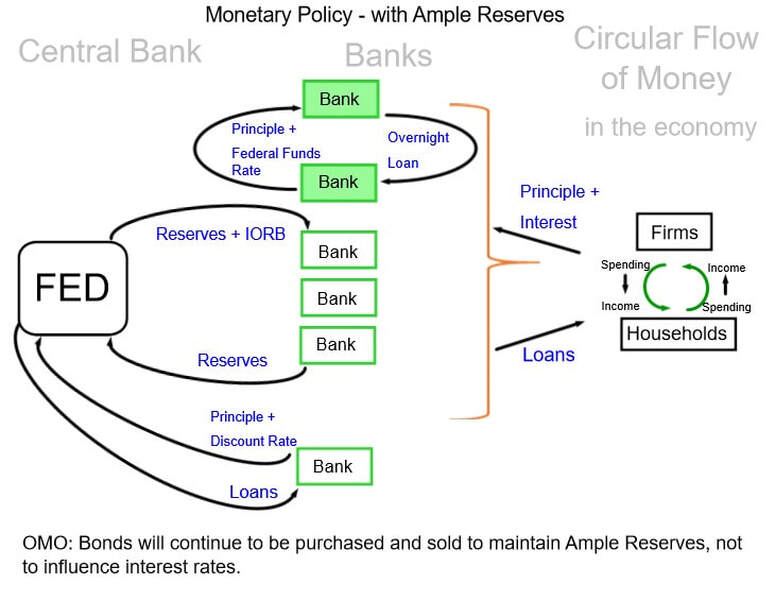
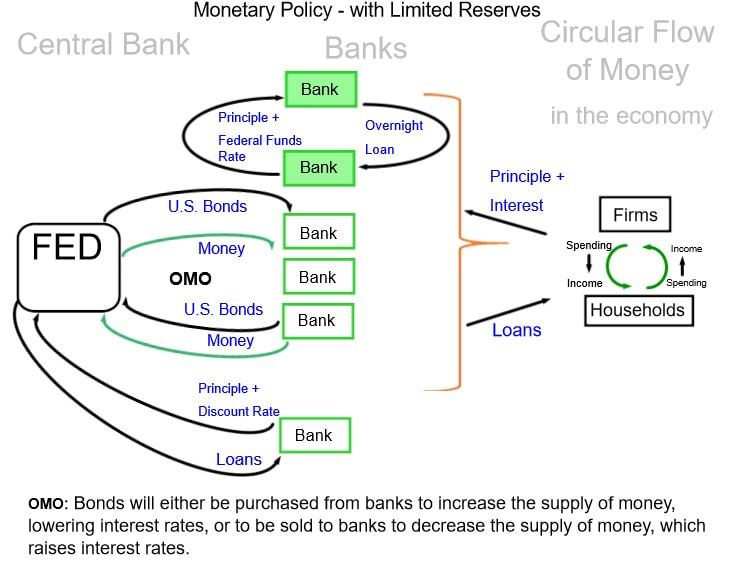
So, OMO will continue to be used to maintain Ample Reserves, but not to influence interest rates. New tools have been developed by the Fed for the more precise control of the interest rates. Consider the diagram below that attempts to demonstrate the use of Interest on Reserve Balances (IORB, or just IOR) and the Discount Rate to influence the use of money in the Circular Flow, the economy. Read and Watch the "Monetary Policy" videos in the link to the Federal Reserve that is below the "Reserves Market diagram.
So, OMO will continue to be used to maintain Ample Reserves, but not to influence interest rates. New tools have been developed by the Fed for the more precise control of the interest rates. Consider the diagram below that attempts to demonstrate the use of Interest on Reserve Balances (IORB, or just IOR) and the Discount Rate to influence the use of money in the Circular Flow, the economy. Read and Watch the "Monetary Policy" videos in the link to the Federal Reserve that is below the "Reserves Market diagram.
Ample Reserves - Tools for Managing the Supply of Money to the Economy
Federal Funds Rate
The federal funds rate is not a tool of the Fed, but is the focus of the following tools that will be discussed.
The federal funds rate is the interest that banks charge for overnight loans to other banks. Why would banks need to borrow money overnight? Perhaps they have a liquidity problem, not enough cash on hand, and do not have enough cash available to comfortably handle normal operations going into the next business day. Remember, a bank is a business, and is in business to earn a profit. Consequently, lending banks charge borrowing banks interest to earn money on their money in reserves.
The federal funds rate changes in response to the simple supply and demand for money in reserve between banks. When the supply of reserves is greater than the demand for reserves between banks, the federal funds rate decreases. When the supply of reserves is less than the demand for reserves between banks, the federal funds rate increases.
Interest on Reserves (IOR)
Since ample reserves exist in the monetary system, the Fed uses the IOR to influence how much money will be accessed from banks to be used in the economy, the circular flow of money. The Fed offers to pay banks interest on reserves balance (IORB) that has not been committed to lending.
Suppose inflation is rising too fast during an economic expansion, the Fed may want to discourage the amount of money being borrowed by parties in the circular flow (see above the "Monetary Policy - with Ample Reserves" diagram). The Fed will raise the IOR that they are willing to pay banks for placing their reserves in the FED. Banks place their reserves in the Fed. Consequently, the supply of reserves between banks decreases. The federal funds rate increases between banks. The higher federal funds rate leads to increased interest rates to the parties in the circular flow. Households and firms borrow less money. The supply of money in the economy decreases or stops growing. The inflation rate slows.
Suppose unemployment is rising due to decreasing economic activity between firms and households. The Fed may want to encourage the amount of money being borrowed by parties in the circular flow (see above the "Monetary Policy - with Ample Reserves" diagram). The Fed will lower the IOR that they are willing to pay banks for placing their reserves in the FED. Because there isn't a financial advantage for placing reserves in the Fed, the supply of reserves between banks increases. The federal funds rate decreases between banks. The lower federal funds rate leads to decreased interest rates to the parties in the circular flow. Households and firms borrow more money. The supply of money in the economy increases. Increased sales supports existing jobs and stimulates the creation of jobs.
Using the IOR in this manner sets the upper limit banks will set for the federal funds rate.
|
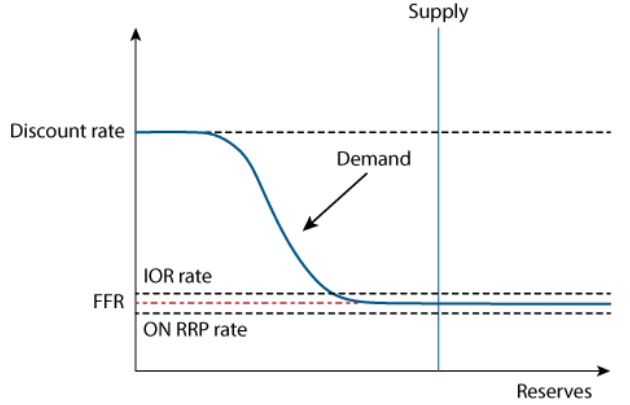
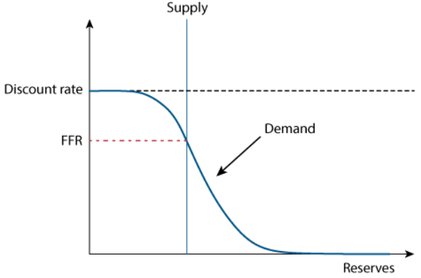
The Reserves Market with Ample Reserves:
The Fed money market representation is referred to as the Reserves Market. Notice the vertical money supply curve to represent all the money in the market at a moment. The y-axis will be labeled or understood as the Policy Rate. The x-axis is the quantity of reserves. The intersection of supply of reserves on the lower horizontal area of the money demand curve exposes why a change in money supply would not be effective in altering interest rates. There is too much money in circulation for the Fed to be able to influence the interest rates banks charge the households and firms who borrow. So, the Fed created the IOR to influence the interest rate banks charge borrowers. After you watch the short 4-part video series from the St. Louis Federal Reserve Bank, we'll review the new tools for influencing the interest rates. |
|
Overnight Reverse Repurchase Agreement (ON RRP)
You will see on the Reserves Market above the Federal Funds Rate (FFR) that exists between banks, the red dashed line that becomes the demand curve for funds. Just above that there is a black dashed line labeled IOR rate, Interest on Reserves rate. The Fed uses the IOR to set an upper limit on the FFR. Just below the FFR is another black dashed line labeled ON RRP rate, Overnight Reverse Repurchase rate. The Fed offers banks that are not in the Federal Reserve System the opportunity to earn a rate of return on their reserves through an Overnight Reverse Repurchase Agreement. The non-system banks can place their reserves with the Fed overnight. The next day the banks reclaim their money, plus interest, from the Fed. The use of the ON RRP agreement is to influence the rate of return on overnight loans between banks that are outside the Federal Reserve System, and thereby influencing these banks' interest rates to the households and firms in the circular flow. The ON RRP rate is lower than the FFR, and is used as a lower limit, below which the FFR will not be offered.
You will see on the Reserves Market above the Federal Funds Rate (FFR) that exists between banks, the red dashed line that becomes the demand curve for funds. Just above that there is a black dashed line labeled IOR rate, Interest on Reserves rate. The Fed uses the IOR to set an upper limit on the FFR. Just below the FFR is another black dashed line labeled ON RRP rate, Overnight Reverse Repurchase rate. The Fed offers banks that are not in the Federal Reserve System the opportunity to earn a rate of return on their reserves through an Overnight Reverse Repurchase Agreement. The non-system banks can place their reserves with the Fed overnight. The next day the banks reclaim their money, plus interest, from the Fed. The use of the ON RRP agreement is to influence the rate of return on overnight loans between banks that are outside the Federal Reserve System, and thereby influencing these banks' interest rates to the households and firms in the circular flow. The ON RRP rate is lower than the FFR, and is used as a lower limit, below which the FFR will not be offered.
The Discount Rate - The Fed Lending to Banks
Sometimes banks determine that they do not have enough money in hand to meet their cash flow needs to cover depositor withdrawals, to make new loans, or some other business reason. In this situation, banks may borrow money from the Fed. The Fed will lend the money to the bank, but will also charge the bank interest on the loan. Perhaps to avoid confusion with the interest that the public pays the banks on loans, the interest the banks pay the Fed is called the discount rate. The Fed sets the discount rate much higher than the IOR. The Fed wants to be the lender of last resort. The high interest rate forces banks to go to other banks for their normal operational needs.
Sometimes banks determine that they do not have enough money in hand to meet their cash flow needs to cover depositor withdrawals, to make new loans, or some other business reason. In this situation, banks may borrow money from the Fed. The Fed will lend the money to the bank, but will also charge the bank interest on the loan. Perhaps to avoid confusion with the interest that the public pays the banks on loans, the interest the banks pay the Fed is called the discount rate. The Fed sets the discount rate much higher than the IOR. The Fed wants to be the lender of last resort. The high interest rate forces banks to go to other banks for their normal operational needs.
Additional Government Regulation of the Banks by the Fed, and by Central Banks.
- Deposit insurance: Federal Reserve System banks are required to carry Federal Deposit Insurance Corporation (FDIC) deposit insurance up to $250,000 per account. CENTRAL BANKS in other countries also require deposit insurance.
- Capital Requirements: both physical and financial assets, in excess of the depositors’ accounts are required by Central Banks, including the Fed.
- Reserve Requirements for the banks are set by the CENTRAL BANK, not by the Fed.
- A Discount Window is maintained by CENTRAL BANKs, and the Fed. Banks who are short of cash to maintain normal operations can borrow money from the CENTRAL BANK, or the Fed, at a discount rate (an interest rate the banks pay the CENTRAL BANK, or the Fed.
M Ch. 29
Central Banking System with LIMITED RESERVES
The Central Banking with limited reserves is no longer used by the U.S. Federal Reserve System. However, the limited reserves system is used by central banks around the world for managing interest rates and the supply of money to the economy, the circular flow.
The following videos that are linked refer to the Fed. They were created when the U.S. central banking system used the limited reserves regime. When you hear reference to the Fed, think of central banks in all other countries.
The following videos that are linked refer to the Fed. They were created when the U.S. central banking system used the limited reserves regime. When you hear reference to the Fed, think of central banks in all other countries.
Banks and the Money SupplyHouseholds and firms hold money in their pockets and in demand deposits (checking accounts) at the bank. From this supply of money they spend in the marketplace. The Central Bank influences the buying behavior of households and firms, by influencing the amount of money banks have to lend to households and firms. This is also true of the Federal Reserve System in the U.S.. So, the Circular Flow Model to the right represents the economy. Starting from the bottom, the Central Bank indirectly influences the supply of money in the circular flow by affecting the quantity of money the banks have to loan to firms and households that are participating in the circular flow of money.
|
|
Banks and Money Supply |
M Ch. 29
|
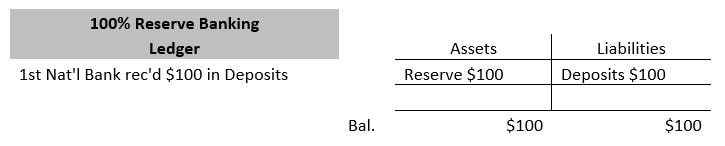
Accounting for the banks can be demonstrated in simple terms. If a bank customer places $100 in a bank, the money is a liability to the bank because it must return the money to the customer. The money is also an asset, because while the money is in the possession of the bank, the bank may use the money. In the ledger below, the $100 is recorded as both a liability and an asset. Notice the balance has to be equal between the assets and the liabilities in each of the following examples.
100% Reserve Banking
In this economy the Central Bank has ruled that banks must hold 100% of the deposits in reserve. Consequently, the banks cannot use the deposit for loans or influence the supply of money.
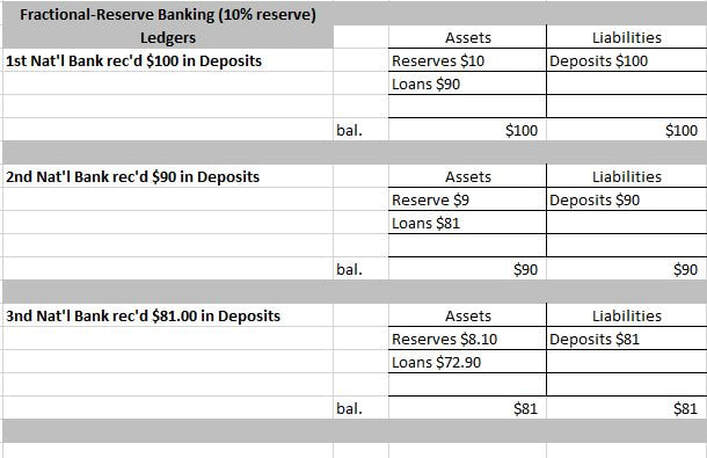
Money Creation with Fractional-Reserve Banking
In this second case, the Central Bank has set the required reserve ratio (RRR) at 10%. The banks must hold 10% of every deposit so they won't run short of cash when the typical percentage of customers withdraw money for everyday expenses. The remaining 90% the bank may loan out to others in the community. The interest earned from the loans will be split between the depositors for the use of their money, and the bank to cover expenses and a little profit.
Note that the banks don't have to lend out all that they are allowed to lend. They may hold in reserve more than they are required, called excess reserves. Also, note that a bank may choose not to loan out money, but to invest in securities (bonds). Reserves, Loans and Securities are all listed under Assets.
How does fractional-reserve banking create money? THE MONEY MULTIPLIER
Think about it. The people who borrowed the money will spend the money. The money will be placed in another bank, who is also required to hold 10% in reserve, but will loan out 90%. Then borrowers will spend that sum of money, which will land in another bank. Ten-percent will be held in reserve and 90% will be loaned. While the amount loaned is getting smaller each time compared to the original deposit, the amount of money in circulation is growing.
There is a way to calculate the total increase in money supply by using the reserve rate ratio. It's called the Money Multiplier. The Money Multiplier is the reciprocal of the reserve requirement. Therefore,
If the Central Bank wants to increase the supply of money, they may lower the RRR, which increases the amount banks may loan, and the multiplier effect is larger.
If the Central Bank wants to decrease the supply of money, they may raise the RRR, which decreases the amount banks may lend, and the multiplier effect is smaller.
There is a way to calculate the total increase in money supply by using the reserve rate ratio. It's called the Money Multiplier. The Money Multiplier is the reciprocal of the reserve requirement. Therefore,
- 10% = 10/100 which becomes 100/10 or a multiplier of 10
- 5% = 5/100 which becomes 100/5 or a multiplier of 20
- 4% = 4/100 which becomes 100/4 or a multiplier of 25
If the Central Bank wants to increase the supply of money, they may lower the RRR, which increases the amount banks may loan, and the multiplier effect is larger.
If the Central Bank wants to decrease the supply of money, they may raise the RRR, which decreases the amount banks may lend, and the multiplier effect is smaller.
M Ch. 29
Tools of Central Banking System with LIMITED RESERVES
The Central Bank's Tools for Monetary Control
The Central Bank has 3 tools for controlling the supply of money to the economy through the banking system:
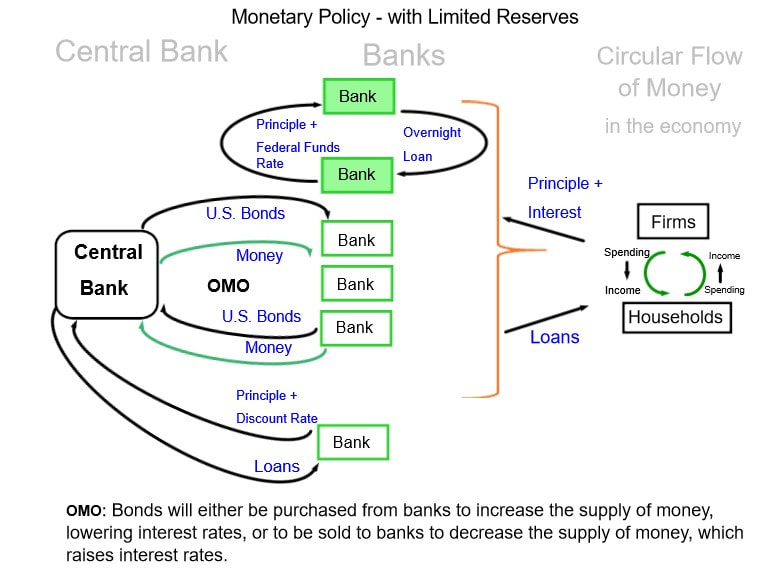
- Open Market Operations (OMO) (buying and selling government bonds)
- the discount rate (the Central Bank lending to banks)
- the Required Reserve Ratio (RRR)
Open Market Operations (OMO)
Remember that a bond is an I.O.U.. An organization sells their promise to pay you after a period of time the amount of money that is on the face of the bond certificate, face value. if you, a member of the public, buy a bond, you are lending the organization money. You buy the bond at an amount of money below the face value, discount rate. There are both corporations and governments of all levels who issue bonds to raise money for projects.
The Open Market Committee (OMC) of the Central Bank conducts OMO to manage the supply of money to the economy. The OMC issues orders to its bond traders at one of the Central Bank branches to buy or sell government bonds in the nation's bond markets.
The Open Market Committee (OMC) of the Central Bank conducts OMO to manage the supply of money to the economy. The OMC issues orders to its bond traders at one of the Central Bank branches to buy or sell government bonds in the nation's bond markets.
- To increase the supply of money, OMO will buy bonds from the public or from primarily commercial banks, placing money in their hands for use in the economy. The money supply will grow by the money multiplier because the public will place the money in the bank who has a reserve requirement. Of course the public will spend the money, but banks will eventually see that money get transferred through their customers accounts.
- To decrease the supply of money, OMO will sell bonds to the public or to primarily commercial banks, taking money out of their hands. The money supply will contracts by the same amount of money that was taken out of the hands of the public when the bonds were sold. There is no multiplier effect because the Central Bank holds onto the money. There is no RRR on the Central Bank.
The Discount Rate - The Fed Lending to Banks
Sometimes banks determine that they do not have enough money in hand to meet the RRR, to satisfy bank regulators, to cover depositor withdrawals, to make new loans, or some other business reason. In this situation, banks may borrow money from the Central Bank. The Central Bank will lend the money to the bank, but will also charge the bank interest on the loan. Perhaps to avoid confusion with the interest that the public pays the banks on loans, the interest the banks pay the Central Bank is called the discount rate. Remember, interest is the cost for using someone else's money.
- To increase the supply of money, the Central Bank lowers the discount rate. The bank borrows more money because the cost of borrowing money is lower. Having borrowed money, the bank puts the money into circulation and the supply of money to the economy has grown.
- To decrease the supply of money, the Central Bank raises the discount rate. The bank borrows less money because the cost of borrowing money is higher. Having not borrowed money, the bank must lend less money to cover the RRR or to cover depositor withdrawals. Ultimately the bank must keep their assets and liabilities balanced by managing the money within their own accounts. So, the amount of money in circulation may be held steady, or may decrease if the bank has to reduce loans to increase reserves.
The Required Reserve Ratio (RRR)
Introduced above, under Fractional-Reserve Banking (Module 25)
Federal Funds Rate - Overnight Loans between Banks
The federal funds rate is discussed above under the discussion of the ample reserves regime. The earlier description still applies. The difference is how the Fed effects a change in the federal funds rate using the IOR.
Central banks in a limited reserves regime, do not have the IOR as a tool. They have other methods for manipulating the federal funds rate, which will be addressed in the ensuing discussion.
Again, the overnight loan rate is the short-term interest rate that banks charge one another for loans. Banks may find at the end of the day that they are a little short on reserves. To satisfy the reserve requirement, banks may borrow from each other overnight. The overnight loan rate is flexible in that the rate is set by supply and demand for money between banks.
The Central Bank does not set the overnight loan rate. Rather, the OMC identifies a target overnight loan rate and conducts OMO to influence the supply of money within the banks. The sale of bonds to banks reduces the supply of money within the banking system. Consequently, the reduced supply leads to a higher overnight loan rate. The purchase of bonds from banks increases the supply of money within the banking system. Consequently, the increased supply leads to a lower overnight loan rate.
Targeting a overnight loan rate impacts not just the supply of money within the banks, but also has an impact on the supply of money to the whole economy. A lower overnight loan rate means lower operating costs for the bank, which leads to lower interest rates to the public. Lower interest rates mean more borrowing, and expanded money supply in the economy. A higher overnight loan rate means higher operating costs for the bank, which leads to higher interest rates to the public. Higher interest rates mean less borrowing, and money supply in the economy will contract.
Problems with Managing the Money Supply
Managing the quantity of money supplied to economy is not an exact science.
First, the Central Bank can't control how much households choose to hold in currency or choose to place in the banks. The decisions households make about their money is based upon their level of confidence in the economy and/or in the banking system. If the households lose confidence in the banking system and choose to deposit less money, the reserves will decrease and the banks will have less to lend. Consequently, the RRR/money multiplier becomes ineffective in expanding the money supply. The Central Bank's monetary policies can influence, but cannot control the decisions made by the households.
Second, the Central Bank does not control how much bank allocate for loans. Banks, as independent businesses, may hold excess reserves when they perceive the economy threatens their business, which diminishes the Central Bank's influence on the economy.
The Money Market |
M Ch. 34
|
|
Money Demand and Equilibrium in the Money Market:
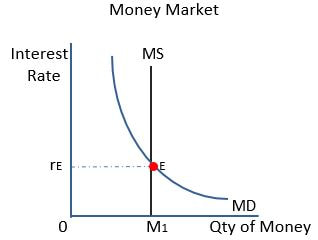
Remember that the Central Bank manages the supply of money primarily by buying and selling government bonds through open market operations (OMO). OMO affects the quantity of reserves banks hold, but more importantly, the quantity banks have available to supply the economy through loans. To the right is a Money Market Graph. Let's assume the money supplied to the market is fixed. Consequently the money supply curve is vertical and straight. The demand curve for money (MD) is sloped because there is a relationship between the quantity of money demanded and the interest rate. The demand curve can be drawn bowed as it is or with straight constant curve. Actually, the constant curve will be most often used in economics texts. |
|
Where MS and MD intersect there is an equilibrium between the supply and demand and the nominal interest rate is set. The Central Bank operates in the short-run. So, a change in supply of money causes a change in the nominal interest rate. The nominal interest rate is the stated interest rate for a loan, unadjusted for inflation. The nominal interest rate is the rate real interest rate plus the expected inflation rate. The real interest rate is the nominal interest rate minus the actual inflation rate. The real interest rate was discussed earlier when the loanable funds market was introduced and will be discussed in greater detail in Unit 5.
Note: Since transitioning t0 the ample reserves regime, the U.S. Federal Reserve has been using the money market graph below as a representation of the money market with limited reserves in the financial system. This representation is appropriate when discussing the U.S. transition from limited to ample reserves. Placement of the vertical money supply curve through the downward sloping demand curve is a representation of limited reserves. However, since all other nations still function in a limited reserves financial system, it is appropriate to represent their money markets with the graph that is above.
Note: Since transitioning t0 the ample reserves regime, the U.S. Federal Reserve has been using the money market graph below as a representation of the money market with limited reserves in the financial system. This representation is appropriate when discussing the U.S. transition from limited to ample reserves. Placement of the vertical money supply curve through the downward sloping demand curve is a representation of limited reserves. However, since all other nations still function in a limited reserves financial system, it is appropriate to represent their money markets with the graph that is above.
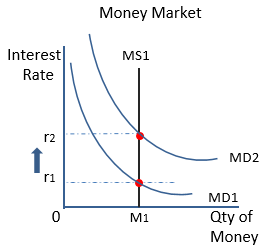
Shifts in Money Demand
|
Reasons Money Demand Increases
(MD shifts right)
|
|
|
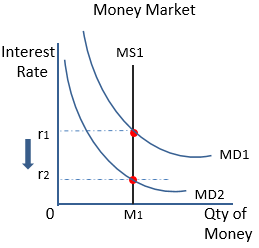
Reasons Money Demand Decreases
(MD shifts left)
|
The Interest Rate and Loans between Banks
Money supply is difficult to measure and the demand for money fluctuates. So, the central banks often focuses on interest rate level and not on money supply. Central banks' officers meet at intervals to assess and set a target the interest rate between banks, rather than a quantity of money supplied. The interest banks charge each other is for overnight loans, borrowed to satisfy the required reserve ratio. The interest on these overnight loans is a cost to the banks and has an impact on the supply of money for loans to bank customers. Remember, this is all about the supply and demand of money,
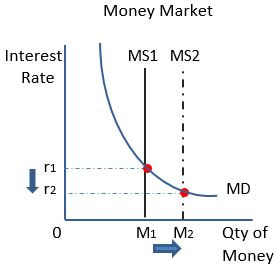
A Monetary Policy for a Recession or a slowing Expansion: The central bank considers aggregate demand is too low to support existing jobs or when unemployment is too high.
|
Goal: Target lower interest rates.
|
|
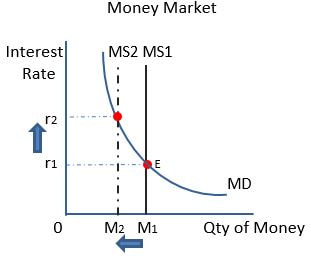
A Monetary Policy for an over heated Expansion and rapidly rising inflation: This policy action may occur when there is too much money in circulation, inflation has occurred, and the cost of living is increasing.
|
Goal: Target increasing the interest rate:
|
|
REVIEW: Central Banking System with LIMITED RESERVES
Monetary Tools
The primary tools of central banks with limited reserves, in order of prominent use are:
Monetary policy is executed to achieve low inflation during economic expansion and low unemployment during economic recession. Managing the supply of money is the avenue for achieving these goals. The monetary tools above are used to manage the supply of money. The scenarios below indicates what policy actions can be appropriately used in each phase of the business cycle with each it's economic problem.
Focusing on the primary tool, open market operations (OMO),
The primary tools of central banks with limited reserves, in order of prominent use are:
- Open Market Operations
- the Discount Rate
- Required Reserve Ratio
Monetary policy is executed to achieve low inflation during economic expansion and low unemployment during economic recession. Managing the supply of money is the avenue for achieving these goals. The monetary tools above are used to manage the supply of money. The scenarios below indicates what policy actions can be appropriately used in each phase of the business cycle with each it's economic problem.
Focusing on the primary tool, open market operations (OMO),
During an economic expansion, the problem is inflation.
- The open market committee will authorize the central bank to sell bonds to the banks to target an increase in the overnight interest rate.
- The banks will have less money to cover operations and the required reserve ratio.
- Banks will borrow from other banks overnight at the overnight interest rate which is higher because money supply has decreased among banks.
- Rather than paying the higher overnight interest rate, banks become more disciplined and conservative in their operations, which leads to a decrease in the supply of money for loans to the circular flow, which represents the economy.
- Interest rates for loans rise, firms and consumers borrow less.
- Consumer spending decreases, and inflation slows or stops rising.
During an economic recession, the problem is high unemployment.
- The open market committee will authorize the central bank to buy bonds from the banks to target a decrease in the overnight interest rate.
- The banks will have more money to cover operations and the required reserve ratio.
- Banks will borrow from other banks overnight at the overnight interest rate which is lower because money supply has increased among banks.
- The increase in the supply of money for loans to the circular flow, which represents the economy, leads to lower interest rates.
- Lower interest rates encourage firms and consumers to borrow more.
- Consumer spending increases, and there is an increase in the supply of money to support and create jobs.
- Unemployment declines.
The following video from Mr. Clifford covers both the limited Reserves and the Ample Reserves regimes for the money market.
