Honors Economics
Unit 2: Microeconomics, Consumer Demand, Supply, Market Equilibrium and Market Structure
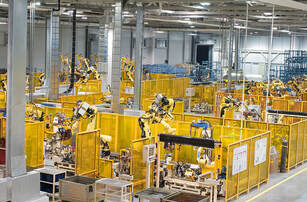
Muslim Quarter, Xian, China
|
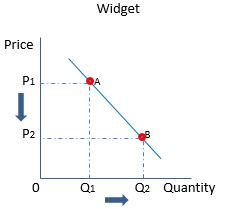
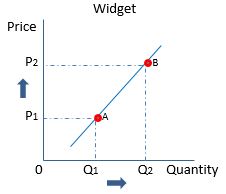
Let's discuss the graphs to the right. Note that Price will always be on the vertical stem and quantity will always be on the horizontal stem.
The demand curve is a graphical representation of a demand schedule showing the relationship between price and quantity demanded. (We will see demand schedules in our exercises.)
|
|

|
Elasticity of Demand is also called Price Elasticity of Demand because consumer demand is being measured in response to price changes. Elasticity is calculated as a fraction. The change in quantity demanded over, or divided by the change in price. I will leave it to you to watch the short explanation from Dr. Reff of Arizona University. Remember when we work out price elasticity problems, use absolute values. If the value is greater than 1, consumer behavior is elastic. If the value is less than 1, consumer behavior is inelastic. If the value is equal to 1, consumer behavior is called unit elastic.
|
|
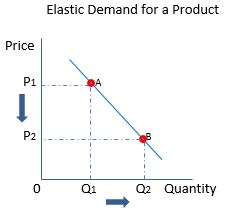
Elastic demand describes consumer behavior that clearly responds to changes in price. In the graph to the right, a decrease in price leads to a relatively large change in demand for a product. Using the equation above, if the demand increased by 40% and price had decreased by 30%, 40/30 = 1.33. Because elasticity is greater than 1, consumer behavior is elastic.
|
|
|
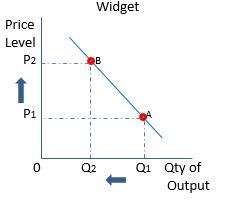
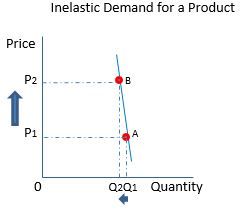
Inelastic demand describes consumer behavior that hardly responds to a change in price. In the graph to the left, a change in price leads to almost no change in buying behavior. Using the equation above, if the demand decreased by just 2% and price had increased by 10%, 2/10 = .20. Because elasticity is less than 1, consumer behavior is inelastic.
|
|
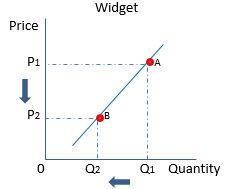
We need to distinguish between a change in quantity demanded and a change in demand. Not understanding the differences leads to errors in communication and on exams. Just above we identified a change in the quantity demanded in response to price.
|
|
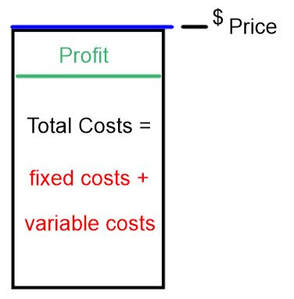
All businesses are in the business to make money (profit). People have the impression that businesses earn a profit by raising their prices. However, this impression is incorrect. Price is what consumers pay for a product. Businesses can't raise the price above what consumers are willing to pay. They will lose sales and money. Businesses try to manage or lower their costs to make room for profit below the price that consumers pay. Costs are classified in 2 categories. Fixed costs are those costs that are the same every month regardless how much goods or services are produced that month. Variable costs are costs that change in proportion to the quantity of goods and services that are produced. To manage their costs, businesses track the change in costs with each unit of product that they produce. The cost of producing an additional unit of product is called marginal costs. The businesses are looking for the optimum number of units of product at the lowest average total cost. At that point they will have maximized the profit to be made from that product.
|
|
|
|
|
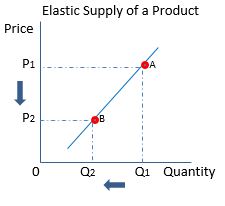
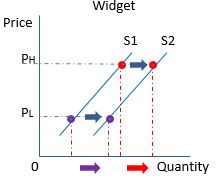
.Elastic supply describes producer behavior that clearly responds to changes in price. In the graph to the right, a decrease in price leads to a relatively large change in supply of a product.
|
|
|
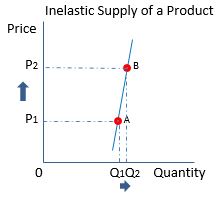
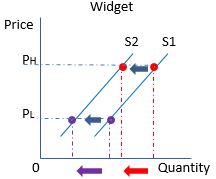
Inelastic supply describes producer behavior that hardly responds to a change in price. In the graph to the left, a change in price leads to almost no change in supply behavior.
|
|
We need to distinguish between a change in quantity supplied and a change in supply. Not understanding the differences leads to errors in communication and on exams. Just above we identified a change in the quantity supplied in response to price.
|
|
|
|
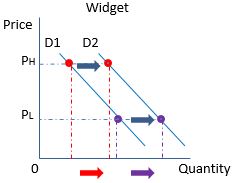
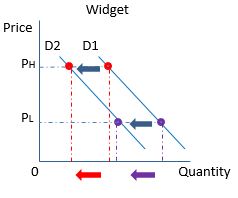
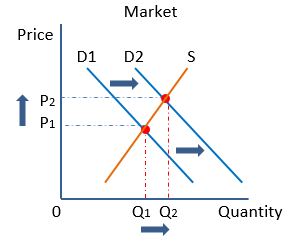
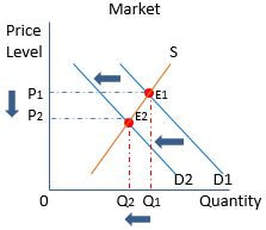
Remember that there may be non-price changes in demand.
|
|
|
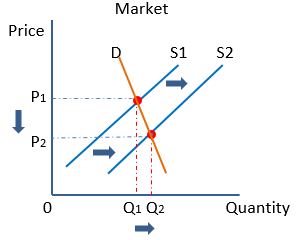
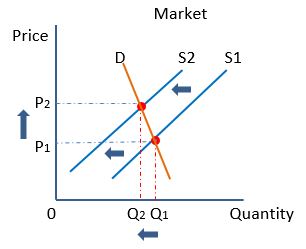
Also Remember that there may be non-price changes in supply.
|
|
|
|
|
|
|
|
|
|
|
|