From here to the end of the course, we will only introduce a few more concepts and graphs to demonstrate. NOW is the time to begin reviewing all the previous concepts and models we have discussed. All of them will come into play in the last two units. The AP exam will expect you to understand what happens in the loanable funds market and the FOREX due to one economic event. Or, what happens in the aggregate market and the loanable funds market? Or, what happens in the money market and the loanable funds or aggregate market or Forex? You will have to be prepared to explain and graph for what occurs in two markets for any one economic event.
Production and Growth
|
AP 5.6
|
Mankiw (M) Ch. 25
|
The goal of any country is to increase productivity and grow the economy. Increased productivity and economic growth lead to higher standards of living for their residents. A consideration of monetary and fiscal policies should be done in the context of the impact on economic growth. Central banks have a mandate to provide stable prices (low inflation), and economic growth (low unemployment). So, attention is given to managing the inflation rate and the unemployment rate. Yet first we need to understand what is meant by "economic growth."
As you recall from Unit 2, Gross Domestic Product (GDP) is the market value of all final goods and services produced within a country in a given period of time.
|
GDP can be used as a measure of economic growth and prosperity. While GDP is not the perfect measure of prosperity, when manipulated as a per capita (per person) value, it can be an indicator of living standards, prosperity and growth. Click the link to the left. Consider the country comparisons of GDP per capita by the World Bank.
|
What you may notice when surveying the per capita income differences between countries, those countries whose per capita income is higher we perceive as developed countries that are prosperous. They have higher standards of living or better quality of living conditions. Countries with very low per capita incomes we perceive as developing nations that are not so prosperous and have lower standards of living, and lower quality living conditions. This is not suggesting that there is no poverty in countries of high GDP per capita, but the number of people in poverty is likely comparatively low. Also, notice, nations that we consider as developing are, in fact, seeing their GDP per capita growing. So, the goal is to use this GDP per capita data to make decisions about growing the GDP per capita and lift one's country to greater prosperity and better living conditions.
What is economic Growth?
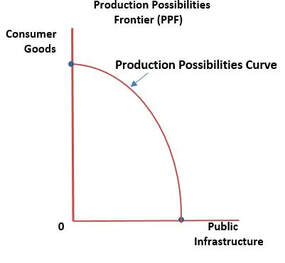
Economic growth is an increase in the maximum output of goods and services an economy can produce. This can easily be understood if we return to our simple production possibilities curve (PPC) on the production possibilities frontier (PPF).
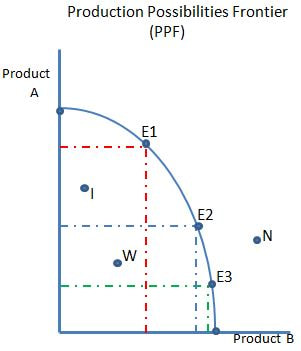
Note in our imaginary country, it produces 2 products. If it efficiently commits all of its resources (land, labor and capital) to the production of these 2 products, it can produce any combination of products A and B along the PPC, E1, E2 and E3. If the country inefficiently uses its resource or is wasteful, it will produce some combination of products A and B that is below its potential output on the PPC. Consequently, they produce inside the PPC at like points I and W. If the country attempts to produce beyond its PPC, it is simply not sustainable or possible because they do not have the resources to produce at that level, like point N.
Suppose that our imaginary country is able to increase at least one of its factors of production. It is then likely that the country will be able to produce more of products A and B in any combination. In the graph this would be reflected by the PPC for the country shifting outward. Point G on the yellow PPC is one of the points on the PPC that would reflect economic growth. It would be a new possibility for efficient use of all available resource. Points I, W and any other combination within the new PPC would still represent inefficient and wasteful production. Point N still represents production that is not sustainable or possible. Points E1, E2 and E3 would be shifted out to the new PPC at possible efficient production levels.
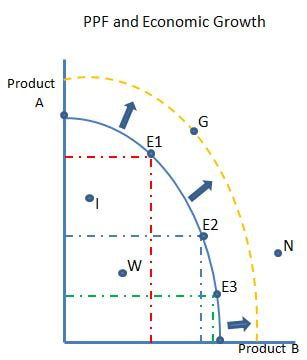
So, the key to economic growth for a country is to find some way to increase the available resources or factors of production. If a country can increase their available resources, they can increase the maximum output of goods and services their economy can produce. If they increase their output of goods and services, they should see an increase in their GDP and, hence, their GDP per capita. Ultimately, the country should see an increased prosperity for its citizens, better living standards or improved quality of living conditions.
There are big gaps between developed and developing nations. Has any of the attention and aid given to the problems of developing nations achieved any progress for these nations? Watch and listen to the links below of Hans Rosling discussing the problems and progress in the following videos. [While Dr. Rosling has passed away, you can watch many more videos of Dr. Rosling and the staff of demographers at https://www.gapminder.org/.]
Which resources should a country seek to increase?
The factors of production with which a country has to produce are land, labor and capital. This is much too general for a country to plan for economic growth. Perhaps the following approach to resources would be better for understanding the policy actions of a country toward achieving economic growth.
- Physical Capital per Worker: Remember that capital are the tools, equipment, buildings, vehicles and machinery that are needed to produce a goods or services. This is called Capital Stock. If a country can pursue policies and programs that increase the quantity of capital per worker, each worker's potential to be productive has been increased. A country might use tax credits, tax deductions, or government subsidies to encourage business investment in new capital. The government may spend to build infrastructure.
- Natural Resources per Worker: Of course, a country needs natural resources to produce goods and services. If a country can increase the availability of natural resources to each worker, workers will have more from which to produce more goods and services. Again, the country could offer tax incentives and subsidies to businesses to find more natural resources through exploration, mining, and managing our land more efficiently. Also, the government can facilitate trade agreements with other nations for resources which are needed.
- Human Capital per worker: (Pay attention to the difference between this and the next determinant in economic growth. They are close but different.) Human capital refers to the knowledge, skills and abilities that each worker has for manipulating the capital while turning the natural resources into goods and services. Remember that productivity is the quantity of goods and services produced from each unit of labor input (worker). So, if a country can enhance and improve the education and training of it's people, as workers, they become more efficient, productive, and perhaps more innovative workers. A country might spend more public funds on schools, colleges, career/technical training, libraries and teachers. It might also invest in public health programs because healthy workers are more able to use their knowledge, skills and abilities than unhealthy workers.
- Technological Knowledge: Technological knowledge refers to our understanding of the best way to produce goods and services. Scientific research, new technological development, or data analysis are among the activities that lead a country to refine production methods and toward more efficient use of resources. Remember, the goal is to produce more goods and services at a higher quality from less resource inputs. A country can use public funds or use tax credits, deductions, or government subsidies to encourage businesses to invest in research and development of better production methods. Note that technological knowledge will be transferred to human capital through the educational systems that are established within the country.
Other Factors that Influence Availability or Use of Resources.
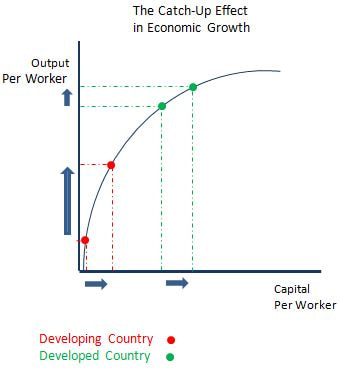
The answer is not so simple. A developing country, who has not been using resources efficiently or has few resources, will realize larger gains in economic growth from additional resource inputs. A developed country, who has been using available resources efficiently, will realize smaller gains in growth from additional resource inputs. Consider the graph.
|
Notice that the Developing Country and the Developed Country have both increased their capital per worker by about the same amount. Yet, also notice that the developing nation receives a greater boost in output per worker and economic growth than the developed country.
|
|
This situation is called the catch-up effect, where the developing country experiences greater economic gains from resource inputs than a developed nation. The developed nation experiences diminishing returns from resource inputs. The developed nation will realize economic gains, but the gains will get smaller and smaller as they become more and more developed. So, with the same resource inputs, the developing nation will make greater progress to catch-up with the developed nation. Until recently China has experienced double digit economic growth rates. Even now with a single digit growth rate, China's economic growth rate is than the USA. China is still a developing country, but they are experiencing the catch-up effect. Eventually, China will be a developed country, and will experience the diminishing returns on resource inputs like every other developed nation.
Economic Growth in Macroeconomic Models
This is a bit of a review. You have just seen the expansion of the Production Possibilities Curve and the Catch-up Effect demonstrated. You have also seen in an earlier unit the Aggregate Market in the long-run and short-run when growth occurs.
|
As a country acquires resources,
|
|
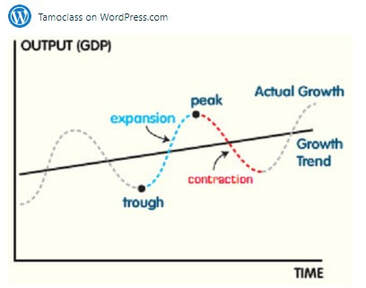
The Business Cycle is a model of economic growth. I want to give the Tamoclass credit for this simple graph (tamoclass/.wordpress.com). It's excellent.
The individual phases of the business cycle are represented as short-run, but the trend line is the long-run growth. The aggregate market will go through periods of expansion and contraction. However, consistent pursiut of economic growth can achieve better standards of life even when recessions have occurred. |
|
Confused Political Leaders over what is Economic Growth
Political leaders confuse increased aggregate demand and decreased unemployment rate with actual economic growth.
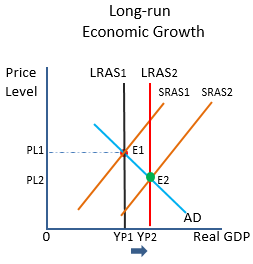
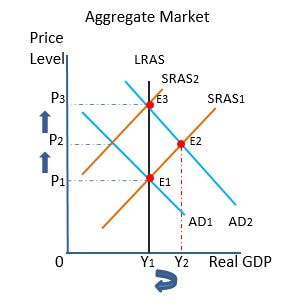
Remember, in the graphic representation of long-run economic growth above, the long-run aggregate supply curve (LRAS) should shift right to demonstrate sustained potential productivity due to increased available resources. Prices would decrease and unemployment would decrease.
Political leaders confuse increased aggregate demand and decreased unemployment rate with actual economic growth.
Remember, in the graphic representation of long-run economic growth above, the long-run aggregate supply curve (LRAS) should shift right to demonstrate sustained potential productivity due to increased available resources. Prices would decrease and unemployment would decrease.
|
However, political leaders often focus on the decrease of unemployment for their constituents and call it economic growth. So,
|
|
AP 5.3
|
M Ch. 30
|
Money Growth and Inflation
At this point we want to discuss the long-run as opposed to the short-run about which we have been primarily discussing. We had discussed the long-run in Unit 3. The classical view of macroeconomics considers economic variables or indicators in terms of nominal or real. Real variables measured in real physical units do not change when the supply of money changes. Therefore, a long-run analysis of the economy can be discussed. The AP Macroeconomics exam will require you to discern within some questions whether you are being asked about an economic condition in the short-run (Keynesian) or in the long-run (classical) perspective. Let's start with a review.
Definitions before we get started:
Notice that there is no specified amount of time. The issue is firms' control over the costs of production which include all the factors of production (land, labor and capital). Firms operate in the short-run and need time to plan for control over costs in the long-run.
- Short-run: The time horizon over which at least one input for an operation is fixed and all other inputs are variable. Therefore, the economy is inflexible in its response to an economic event. In the short-run firms are only able to influence prices through adjustments made to production levels.
- Long-run: The time horizon in which all factors of production and costs are variable. In the long run, firms are able to adjust all costs, (https://index.investopedia.com)
Notice that there is no specified amount of time. The issue is firms' control over the costs of production which include all the factors of production (land, labor and capital). Firms operate in the short-run and need time to plan for control over costs in the long-run.
Keynes v. Hayek, or Central Planning v. Classical Economics
John Maynard Keynes early in the 20th Century advocated that governments ought to look at the whole economy, macroeconomics, and use fiscal policy to manage inflation and unemployment, central planning. Keynes was advocating policy over the short-run. Friedrich von Hayek disagreed and advocated a free market to allow participants to determine quantities of goods and services at acceptable prices, microeconomics. Hayek's arguments were viewing the economy in the long-run with regards to the value of goods and services. Hayek comes from a school of economic thought referred to as Classical Economics. Click the following button and read the short article about Keynes and Hayek.
The Classical Theory of Inflation
The Quantity Theory of Money was first introduced by David Hume in the 18th century and was a building block upon which following classical economists developed other theories and models of economics. The more recent advocates of the quantity theory of money in the 20th century were Friedrich Hayek and Milton Friedman.
The supply of money influences price levels. An increase in the supply of money is accompanied by an increase in prices. A decrease in money is accompanied by a decrease in prices. The rise or fall of prices don't reflect the value of the products sold in the economy. The prices reflect the quantity of money in circulation. You know that something that is in abundance is not as valuable as something that is scarce. When the government increases the supply of money, money becomes less valuable.
Consider a pie for a holiday meal. The more guests you have does not increase the size of the pie. Yet, the pie can be sliced in smaller pieces to accommodate all the guests. Consider the economy, the pie is a pie of value. If more money is printed by the government, the value pie is not enlarged. it is sliced into smaller pieces. Each piece represents an additional dollar printed. Each additional slice or dollar is smaller, or rather, worth less. Prices have to represent the value of the product being sold. So, firms raise the price so the value of the product will be accurately represented by the devalued dollars.
The Level of Prices and the Value of Money
Inflation is:
- more about the value of money, rather than the value of the good; and,
- an economy-wide phenomenon.
- viewed as price of goods and services; or,
- viewed as a measure of the value of money.
- GDP Deflator = (Nominal GDP/Real GDP) x 100
What determines the value of money?
Supply of Money is managed by the Fed and the banking system.
- Demand for money reflects how much wealth people want to hold in liquid form.
- In the long-run the overall prices adjusts to the level at which the demand for money equals the supply of money.
|
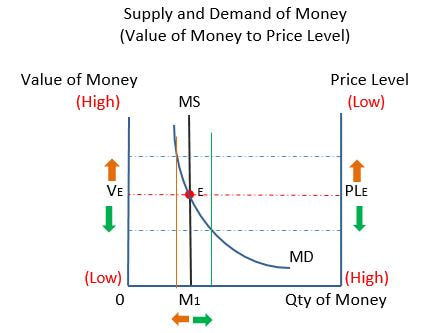
In this graph, the supply of money affects both the value of money and the price level for goods and services.
MS is the money supplied to the economy by the Fed. MS is vertical or inelastic because the Fed establishes the quantity supplied to the economy. An increase in MS is represented by a shift to the right (green). A decrease in MS is represented by a shift to the left (orange). MD is the money demanded by participants in the economy. The value and price equilibrium is where MS and MD intersect. Notice that when money supply increases, where MS and MD intersect, the value of money has decreased and prices have increased (inflation). Notice that when money supply decreases, where MS and MD intersect, the value of money increases and price levels decrease (deflation). |
Classical Dichotomy and Monetary Neutrality
David Hume and classical economists divide economic variables into two groups. The division of variables into two groups is the Classical Dichotomy.
To be a good economist, it is not about either focusing on nominal variables in the short-run, or focusing on real variables in the long-run. Most economists believe that over a short period of a couple years, monetary changes can affect real variables. Over a decade or two, monetary changes have large impacts on nominal variables, but insignificant affect on real variables.
- Nominal variables: measured in monetary units (dollars)
- Price of corn or wheat;
- Nominal wages or annual income
- Interest rates
- GDP
- Real variables: measured in physical units (tonnes, bushels, quantity of goods and services)
- Price of a bushel of corn in terms of the price of a bushel of wheat;
- Real Wages or annual income adjusted for inflation which reflect the rate people exchange goods and services for a unit of labor.
- Interest rate adjusted for inflation which reveals the actual gain or loss.
- Real GDP adjusted for inflation.
- Actual quantity of production of goods and services per unit of labor are real.
- The employment rate is real, because people are real.
To be a good economist, it is not about either focusing on nominal variables in the short-run, or focusing on real variables in the long-run. Most economists believe that over a short period of a couple years, monetary changes can affect real variables. Over a decade or two, monetary changes have large impacts on nominal variables, but insignificant affect on real variables.
Velocity and the Quantity Equation
If you remember at the beginning of our study, we considered the Circular Flow of Income, which can also be considered as a circular flow of spending or expenditures. As an economy expands, one might assume that the speed at which money transfers between hands might increase. When an economy contracts during a recession, might the speed at which money transfers between hands slow down? Velocity of money refers to the speed at which a dollar bill travels around an economy from wallet to wallet. A velocity of money equation has been developed to discover if the velocity of money has an affect on economic growth.
V = (P x Y)/M
Where :
A second equation was developed from the velocity of money equation. It is called the quantity equation .
M x V = P x Y
In this equation the quantity of money relates to the nominal value of output (P x Y).
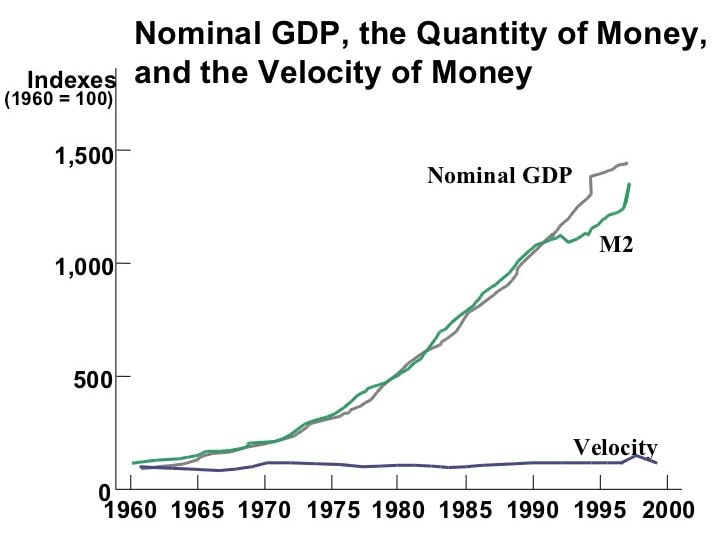
After applying these equations to many years, it was discovered that over decades the velocity of money has been stable, nearly constant, while nominal GDP and money supply (M2) have increased.
V = (P x Y)/M
Where :
- V = velocity of money
- P = price level (GDP Deflator)
- Y = real GDP
- M = quantity of money
A second equation was developed from the velocity of money equation. It is called the quantity equation .
M x V = P x Y
In this equation the quantity of money relates to the nominal value of output (P x Y).
After applying these equations to many years, it was discovered that over decades the velocity of money has been stable, nearly constant, while nominal GDP and money supply (M2) have increased.
|
This graph is all over the web for varying periods of time, but the same representation. The original source of the graph comes from the U.S. Dept. of Commerce and the Federal Reserve.
What this tells us:
|
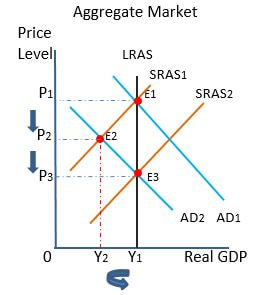
Monetary Neutrality Demonstrated
|
Monetary Neutrality is the concept that regardless of increasing money supply, in the long-run real GDP does not change.
|
Aggregate Market
|
Conclusion: Increased money supply does not lead to increased long-run Aggregate Supply potential output at Y1. Increasing money supply just increases aggregate demand in the short-run, and leads to a higher price level.
|
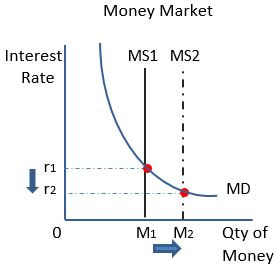
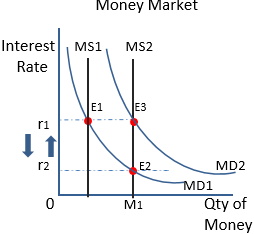
Notice in the Money Market that
|
In the long-run, a change in money supply has a proportional effect on price level, no effect on real GDP (potential output) and interest rates.
In the short-run, a change in supply of money does have a temporary effect on aggregate demand and supply, moving from recession or slowing expansion.
In the short-run, a change in supply of money does have a temporary effect on aggregate demand and supply, moving from recession or slowing expansion.
Demand-pull and Cost-push inflation |
Krugman Mod. 33
|
|
When a nation emerges from a recession,
Demand-pull Inflation occurs in the early expansion:

|
Late in an expansion, Cost-push Inflation occurs when
|
The Fischer Effect - Adjusting Interest Rates for Inflation
Economist Irving Fisher (1887-1947) studied the adjustment of the nominal interest rate to the inflation rate to identify the real rate.
Where: n = nominal interest rate
r = real interest rate
i = inflation rate
The real interest rate is the nominal interest rate minus the inflation rate, or
r = n - i
The nominal interest rate is the real interest rate plus the inflation rate, or
n = r + i
For the AP exam, you may be required to calculate the real, nominal rates, or the inflation rate from an incomplete set of variables. So, simple algebra will be required. incomplete
The Costs of Inflation
Does Inflation lead to lost Purchasing Power?
Hyperinflation is not the norm.
It is generally believed that the loss of purchasing power is normal at all levels of inflation. Yes, in a healthy economy there will be inflation. Yet, the loss of purchasing power may not be as great as people assume. Any purchasing power that a consumer might lose to inflation is short-lived. Inflation occurs primarily during economic expansion. Over the course of the expansion, firms are having to pay more for their factors of production, which includes labor. While there is a lag-time between the increase in price level and the increase in income for workers, workers will be compensated for the value of their labor at the rate of price level growth. So, monetary neutrality remains in effect.
But there are other costs of Inflation....
Shoeleather Costs
During periods of inflation, while the value of money is decreasing, people will demand more money. The higher the prices are, inflation, the more money a transaction requires, and people will choose to hold more money in their wallet or checking account.
To avoid inflation eroding the value of money, people should leave more of their money in interest bearing accounts. People should hold less money in their wallets and checking accounts. Yet, this will incur 'shoeleather costs' of time and effort. As a cliche', people will wear out their shoes making frequent trips to acquire small sums of money, while the remainder stays in interest bearing accounts. The shoeleather costs are the opportunity costs of what could have been done instead of making those frequent trips to the bank.
To avoid inflation eroding the value of money, people should leave more of their money in interest bearing accounts. People should hold less money in their wallets and checking accounts. Yet, this will incur 'shoeleather costs' of time and effort. As a cliche', people will wear out their shoes making frequent trips to acquire small sums of money, while the remainder stays in interest bearing accounts. The shoeleather costs are the opportunity costs of what could have been done instead of making those frequent trips to the bank.
Menu Costs
The reference is to the dilemma restaurants face during periods of inflation. They weigh the lost revenue of keeping prices as they are during inflation against the cost of updating their menus with higher prices to cover their rising costs. Firms that have catalogs face the same issue. Even internet catalogs have to designate resources for keeping the prices up to date with inflation.
Inflation-induced Tax Distortions
- Capital Gains Tax: Legislators do not account for inflation in the tax codes they pass. Inflation exaggerates the size of the capital gains and the tax is on a nominal gain that is greater than the real gain.
- Tax on Interest Income: The nominal interest on savings accounts anticipates inflation but only partially.
Arbitrary Redistributions of Wealth
This concept requires that we recall the phases in the business cycle.
- Remember that during a recession, deflation occurs. Prices and interest rates, as a cost of borrowing, fall during a recession. If a bank lends money at a low interest rate during a recession, and the economy recovers and enters expansion, the banks loses potential income. Why? During Expansion prices and interest rates are rising. Costs for operating the bank is rising. Any loans that were lent during a recession, paid back during the expansion, are being paid back at a rate lower than the current rate with dollars that are not worth as much because of inflation. The banks are losing money on the loan. Wealth is being redistributed to the recession borrowers during the expansion.
- Remember that during the expansionary period of the business cycle, prices and interest rates are rising. If a borrower borrows money at a high interest rate during an expansion, and the economy enters a recession, the borrower is losing money. Why? During a recession prices and interest rates are falling. Any loans that were lent during a expansion, paid back during the recession, are being paid back at a rate higher than the current rate with dollars that are worth more because of deflation. The banks are gaining money on the loan. Wealth is being redistributed to the bank during the recession.
Hyperinflation and the Inflation Tax
In countries that do not have a regulated market and an established system for collecting taxes, they may not have the money to spend upon infrastructure or programs for their citizens' welfare. So, the government decides to pay for these programs by printing more money. Or, it may have been a fairly stable country, but political turmoil has led the country to choose to print more money rather than tax. Printing more money still has the effect of a tax. The government prints more money. The price level increases and the money in your wallet becomes less valuable. The inflation operates like a tax, taking value out of your wallet like a tax.
Trade-off between Inflation and Unemployment
The Phillips Curve
|
AP 5.2
|
M Ch. 35
|
We have discussed the economic fluctuations in the short-run. We noted that inflation occurs during expansion of the business cycle, and unemployment rises during the recession of the business cycle. The government has taxing and spending as fiscal tools to slow the rate of inflation during economic expansions, and to stimulate the economy and job growth during a recession. The Federal Reserve has the interest on reserves (IOR) to manage inflation and unemployment. Other national central banks have the ability to buy and sell bonds (OMO), the discount rate and the required reserve ratio as monetary tools to manage inflation and unemployment. We have discussed how monetary policy and fiscal policy affects aggregate demand and supply, prices, interest rates, and exchange rates. Yet, all of this is in the context of minimizing inflation or unemployment.
Recall the definitions of short-run and long-run from our classical economics discussion in the last unit. These definitions come into play as we will consider short-run aggregate demand (AS), short-run aggregate supply (SRAS), and long-run aggregate supply (LRAS).
Notice that there is no specified amount of time. The issue is firms' control over the costs of production which include all the factors of production (land, labor and capital). Firms operate in the short-run and need time to plan for control over costs in the long-run.
- Short-run: The time horizon over which at least one input for an operation is fixed and all other inputs are variable. Therefore, the economy is inflexible in its response to an economic event. In the short-run firms are only able to influence prices through adjustments made to production levels.
- Long-run: The time horizon in which all factors of production and costs are variable. In the long run, firms are able to adjust all costs, (https://index.investopedia.com)
Notice that there is no specified amount of time. The issue is firms' control over the costs of production which include all the factors of production (land, labor and capital). Firms operate in the short-run and need time to plan for control over costs in the long-run.
AP 5.7
The Phillips Curve in the Short-run and Fiscal Policy Actions
Aggregate Demand and Aggregate Supply and the Phillips Curve
In the short-run, inflation and unemployment have an inverse relationship. The scenarios below demonstrate the inverse relationship between the two. Recall the circular flow of income/expenditures model as you mentally work through these scenarios.
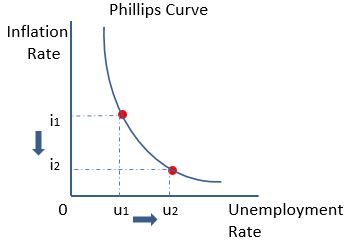
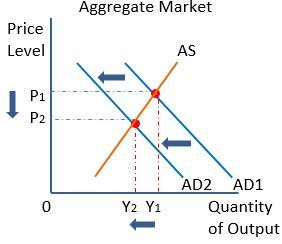
Scenario 1: Expansion and the Problem of Rising Inflation
|
|
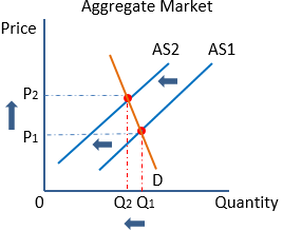
Note the preceding graphs for this scenario. Suppose that inflation is regarded as unacceptably high at i1 on the Phillips Curve graph by the government. Yet the unemployment rate is low at u1.
- To reduce inflation, the government might increase taxes or decrease spending. This fiscal policy reduces the amount of money in the hands of the consumers.
- With less money in hand, households decrease their demand and the aggregate demand curve shifts left from AD1 to AD2.
- Notice that there has not been a change in aggregate supply, but the decrease in demand has forced the firms to offer surplus product at lower prices which have decreased from P1 to P2.
- The lower prices on the Aggregate Market graph are reflected on the Phillips Curve where the inflation rate of i1 has decreased to i2. The goal to reduce inflation has been accomplished.
- However, the Aggregate Market also reflects that quantity of output has decreased. Aggregate Demand has shifted left from Y1 to Y2. With lower market prices, lower profit margins, firms are not motivated to produce the quantity that they had earlier. They begin to lay-off employees to cut costs.
- Observing the Phillips Curve, as the inflation rate decreases from i1 to i2, the unemployment rate is rising, moving right from U1 to U2.
- While the fiscal policy to reduce inflation was successful. unemployment has risen.
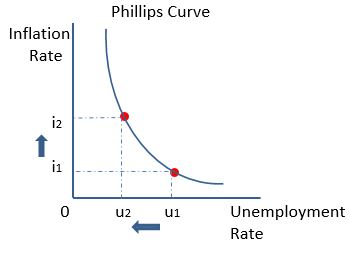
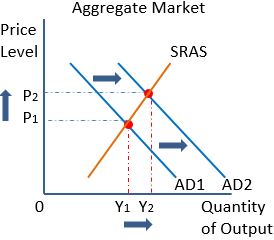
Scenario 2: Recession and the Problem of Rising Unemployment
|
|
Note the preceding graphs for this scenario. Suppose that unemployment is regarded as unacceptably high at u1 on the Phillips Curve graph by the government. Yet the inflation rate is low at i1.
- To stimulate aggregate demand, which would encourage firms to hire more employees, the government might lower taxes or increase spending. Such a fiscal policy puts more money into the hands of consumers.
- With more money in hand, households increase their demand and the aggregate demand curve shifts right from AD1 to AD2.
- Notice that there has not been a change in aggregate supply, but the quantity of output increases and is marked by the rightward movement from Y1 to Y2.
- The increased output requires more workers. Consequently, the employment of more workers is indicated on the Phillips Curve with the leftward movement from u1 to u2, a decrease in the unemployment rate.
- Observe on the Phillips Curve that as the unemployment rate decreases, the inflation rate rises from i1 to i2. This is reflected on the Aggregate Market graph where prices have risen from P1 to P2.
- While the fiscal policy to reduce unemployment was successful. inflation has risen.
Note: Monetary policy may be used to compensate for overreach by fiscal policy. Remember, it may take at least six months before the desired effects of a fiscal policy to be evident. A fiscal policy of lower taxes and higher government spending may increase aggregate demand and lead to decreased unemployment. Impatience of the citizenry, and the need of politicians to appear responsive may lead to too much government spending or tax cuts. The recovery from the recession may mean an expansion with inflation rising too quickly. Consequently, contractionary monetary policy may be used by the Fed to slowly reduce the excess supply of money provided by the expansionary fiscal policy. The Fed may tighten the supply of money to slow the rate of inflation growth.
Long-run Phillips Curve: The Classical View
Connections to What You Already Know
You are about to be introduced to the classical view of unemployment. It's not a radical idea. You have already been introduced to this concept in the first unit and again in this unit before this moment. Consider the links between the three graphs below.
We learned previously that the Production Possibilities Curve (PPC) represents the maximum goods that can be produced and consumed by a country using all available resources. These resources include the maximum use of labor resources. The maximum of employed labor is called full-employment, which is at the natural rate of unemployment.
|
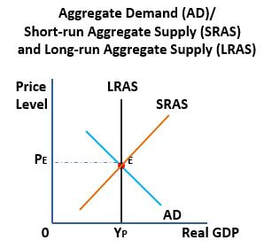
We learned just earlier that the Aggregate Market graph demonstrates the Aggregate Demand (AD) and Short-run Aggregate Supply (SRAS) and also the Long-run Aggregate Supply (LRAS). The LRAS is the PPC. The LRAS and the PPC are both the maximum goods that can be produced and consumed by a country using all available resources. The LRAS supplies the maximum goods when we are at full-employment or the natural rate of unemployment.
|
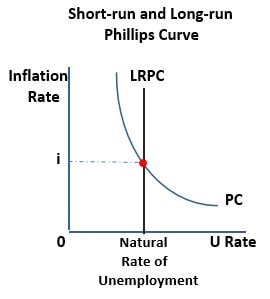
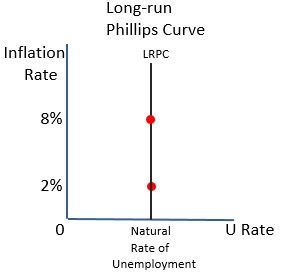
Now you are introduced to the trade-off between either trying to manage unemployment or inflation. They have an inverse relationship in the short-run. Yet, in the long-run, unemployment hovers around a natural rate of unemployment, also called full-employment. The Long-run Phillips Curve is vertical, representing the natural rate of unemployment, no matter the rate of inflation.
|
The Long-run Phillips Curve is Vertical
According to classical economists,
- monetary policy, or money supply affects nominal variables like price and nominal interest rates.
- monetary policy, or money supply does not affect real variables like output and the unemployment rate.
- the unemployment rate tends toward its normal level, the natural rate of unemployment (4%-6% in the US).
- therefore, the long-run Phillips Curve is vertical.
- money growth has only an affect on inflation, not on employment
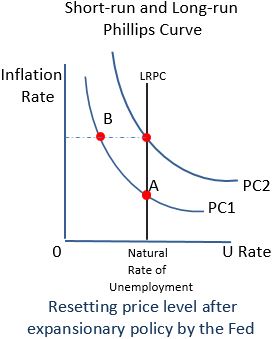
Graphic example:
|
|
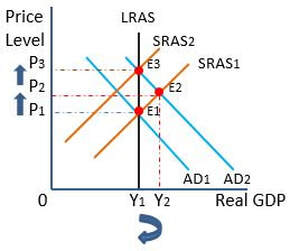
Looking at the preceding graphs, observe the classical point of view.
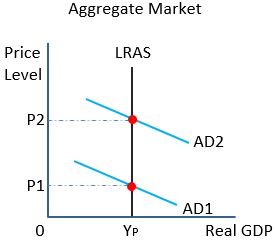
- Referring to the Aggregate Market, in order to stimulate aggregate demand, the Fed increases the supply of money.
- Aggregate demand increases from AD1 to AD2.
- The price level increases from P1 to P2.
- Since monetary policy has no affect on real variables, there is no change in the long-run real output at Yp and the long-run aggregate supply is vertical.
- Referring to the Long-run Phillips Curve, the inflation rate rises from , let's assume, 2% to 8%.
- Yet, since monetary policy has no affect on real variables, the number of people unemployed remains at the natural rate of unemployment, 4% to 6%, in the long-run.
Wait! We know that Unemployment decreases during increasing Inflation
|
Yes. That's true in the SHORT-RUN.
Classical economists are looking at the long-run. Observe the interaction between the short-run and long-run Phillips curves to the left.
|
Remember the Sticky Wage Theory, in the short-run
Regarding the example immediately above, the three points of the Stick Wage theory are important.
- Nominal wages are set on the price level workers and firms expect to prevail;
- When prices are high, firms are motivated to raise output and employment;
- When Prices are low, firms are motivated to reduce employment and output.
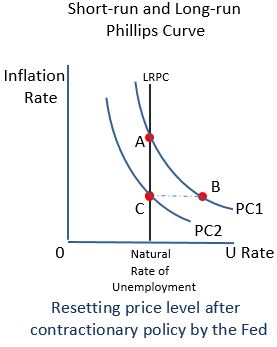
The Cost of Reducing Inflation (Disinflation)
The Sacrifice Ratio
|
If a nation wants to reduce inflation, it must endure a period of high unemployment and low output.
|
|
.The commitment to lowering the inflation rate, or price level, requires sacrifice. Studies have observed that there is a ratio of output sacrificed to accomplish 1 percentage point of lower. A typical sacrifice ratio is a sacrifice of 5% of output to accomplish 1% decrease in inflation. Let's not lose sight that decreased output mean lost jobs. A commitment to a policy to reduce inflation requires political will and communication with the citizens to sustain the sacrifice of jobs for lower price levels.
Paul Volcker, Federal Reserve Chairman during President Ronald Reagan's administration, attempted this policy of Disinflation. Studies showed than the policy did not lead to lower inflation as quickly as the Rational Expectations Theory might have suggested.
Paul Volcker, Federal Reserve Chairman during President Ronald Reagan's administration, attempted this policy of Disinflation. Studies showed than the policy did not lead to lower inflation as quickly as the Rational Expectations Theory might have suggested.
Rational Expectations and the Possibility of Costless Disinflation
As Volcker was about to initiate his policy of disinflation, a group of economists provided a theory that suggested that monetary policies aimed at disinflation could be costless. The theory suggested that if the government would make a credible commitment to a policy of low inflation, people would adjust their rational expectations of inflation (prices). The short-run Phillips Curve would shift downward without the cost of temporary high unemployment. The economists suggested that previous attempts at disinflation were due to a lack of expectation that the government was serious about reducing inflation. Paul Volcker was very public about his policy to reduce inflation. There was no reason for people not to expect that he was serious about reducing inflation. The theory of Rational Expectations just didn't work out as expected. Maybe a policy of disinflation can't be costless.
Implications for Policymakers
Policymakers should be making decisions based upon long-run factors to accomplish long-term goals related to economic growth.
Short-run economic indicators should not be the basis of long-term goals. Policymakers should use their fiscal and monetary tools for short-run stabilization of the economy, and not see them as tools to accomplish long-term goals.
The natural rate of unemployment seems to be beyond the influence of monetary policy. Therefore, policymakers need to improve the functioning of the labor market by addressing minimum-wage laws, collective bargaining laws, unemployment insurance, and job training programs. Policymakers need to address the long-term goals based upon increase human capital, improved educational systems, health systems and infrastructure, and on trade policies that lead to increased resources.
NOW! START TO REVIEW!! (We've only have a little more content to cover.)
Jacob Clifford has provided 3 great videos to review what we have studied. for the AP Macroeconomics Exam. You might want to have your notes out while you watch to look at and hear the content from two perspectives.
The first video reviews the graphs that will be referred to in multiple choice questions or you will be asked to draw in a free response question (FRQ).
The second video is 15 minutes long. Notice that he has placed boxes around segments of content. If you are unclear on that content segment, click on the box and you will be taken to a video just on that segment.
The third video is 29 minutes and covers the entire course content in greater detail. Perhaps you will want to purchase Mr. Clifford's AP Macro preparation book.
